In doing research for my series on the history of Howard County Council redistricting one thing that became apparent was the major impact that the founding of Columbia had on the population growth of Howard County. That prompted me to put together a spreadsheet of Howard County population from 1950 through 2009 from US census data. The data is also available as a text file suitable for use with the R statistical package.1
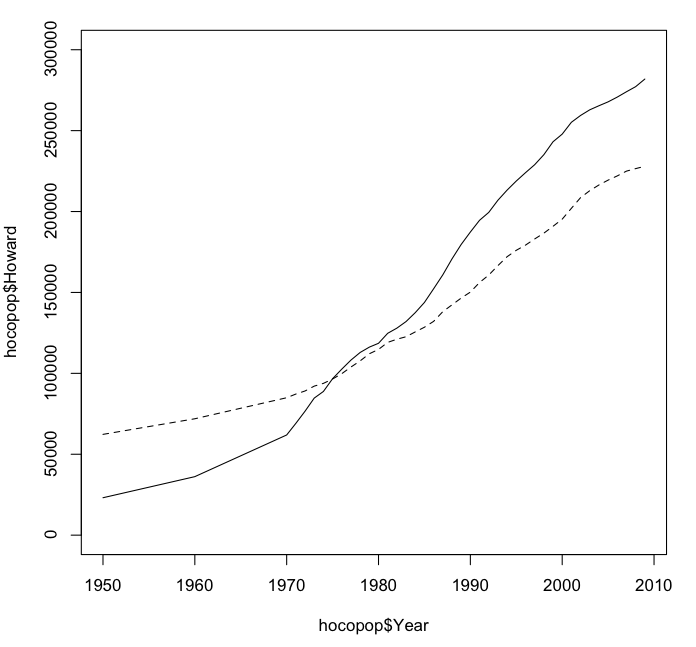
The best way to get a feel for Howard County’s growth is to graph the data. The following plot shows Howard County’s population (solid line) compared to that of neighboring Frederick County (dashed line), another Maryland suburban county that experienced significant growth in the second half of the twentieth century.2
While the population of Frederick County increased almost four-fold over the past sixty years (from 62,287 to 227,980), the population of Howard County grew more than twelve-fold (from 23,119 to 281,884), spurred by the impact of Columbia.
The spreadsheet also gives year-on-year increases in population for Howard County. Note that in the early 1970s Howard County was experiencing over 10% population growth per year, a rate which if continued would have doubled Howard’s population every seven years. As it was Howard County grew over 43% from 1970 to 1974 (61,911 to 88,800). We’ll see the political implications of this increase in population in part 2 of the history of Howard County Council redistricting.
wildelakemike (mdavis@darslaw.com) - 2010-11-30 13:32
While I can’t argue with your numbers, Frank, there are a few other considerations. Frederick County had a more established population center, the City of Frederick, long before 1950. Howard County really didn’t have that center since Ellicott City was so constrained by its topographical limitations. This means that the percentages of growth are not truly indicative of the relative growths of the counties. However, the actual growth in populations is important, and, arguably would have occurred without a “Columbia” due to Howard County’s proximity to Baltimore, Washington, and the various edge cities that have grown up around the B/W Corridor and Beltways. Even today, in my unresearched opinion, there is no population center in Howard County that comes close to the City of Frederick. Maybe that will change with the new plans for Columbia’s downtown, but the densities even then will not match that of the City of Frederick.
hecker - 2010-11-30 14:50
I agree that Howard County would have seen major growth even without Columbia, due simply to its favorable location; I think that’s something that people tend to forget. How exactly that growth would have occurred is an interesting exercise in alternative history. Re relative population density in the city of Frederick vs. Columbia, that’s something that would require looking into more granular Census data. It might be an interesting exercise for some future post.
Trevor - 2010-12-02 17:31
Frank, I just wanted to let you know that as we were discussing population growth at last night’s River Hill Master Plan meeting, I brought up the information you put in this post. I wasn’t the only one there that has seen this. I wanted to say thank you for getting this information together and sharing it with us. As we work to plan a positive future for a community, it helps greatly to understand what happened in the past.
Population data is from the following sources:
- Maryland: Population of Counties by Decennial Census: 1900 to 1990.
- Preliminary Estimates of the Intercensal Population of Counties 1970–1979.
- Intercensal Estimates of the Resident Population of States and Counties 1980–1989.
- Estimated population of Maryland counties 1990–1999 from County Population Estimates and Demographic Components of Population Change: Annual Time Series, July 1, 1990 to July 1, 1999. (Note that the estimates are in reverse order from 1999 down to 1990, followed by the actual census figure for 1990; see the documentation on the file layout.)
- Annual Estimates of the Resident Population for Counties of Maryland: April 1, 2000 to July 1, 2009. (See line 3 of the file for the format.)
Figures for census years (1950, 1960, etc.) are actual census values. Figures for all other years are estimated. Note that the Census Bureau apparently did not produce intercensal population estimates for counties prior to the 1970s. ↩︎
This plot was produced as follows:
> hocopop <- read.table("hoco-population-1950-2009.txt", header=TRUE)
> plot(hocopop$Year, hocopop$Howard, type="l", ylim=c(0, 300000))
> points(hocopop$Year, hocopop$Frederick, type="l", lty=2)
>
(The
type="l"parameter plots a line instead of points, and thelty=2parameter produces a dashed rather than solid line.) ↩︎
