tl;dr: I have fun creating graphs and maps with building permit data from data.howardcountymd.gov.
I’ve written previously about the cornucopia of interesting data sets that Howard County government has made available at the data.howardcountymd.gov site. I had some spare time over a long weekend and decided to try analyzing some of that data, including making use of the various map files on the site (under the “Spacial Data (GIS)” tab).
The particular data set I decided to start with was for building permits issued for residential and commercial construction—not because I have a burning interest in building permits but because I mentioned this type of data in my last post and thought it would be a relatively easy data set to analyze. The particular question I decided to look at was how many residential building permits were issued in each zip code within Howard County in 2014—basically to get a feel for where the most construction was occurring in the county. (It’s only an approximate measure because some permits cover multiple units.)

To do the analysis I used the skills and the tools I learned in the courses that are part of the Johns Hopkins data science specialization series on Coursera. (See my Coursera-related posts for more on my experiences in these classes.) I won’t go over the process here since I’ve separately published full details on my RPubs page, with the source code available in my hocodata GitHub repository.
I first created a simple table of the top zip codes for residential permits issued. This was sort of boring so I won’t reproduce it here; you can find it in the first example analysis I did. More interesting is the bar chart I created as part of the second example. It’s clear from the chart that there’s wide variation among Howard County zip codes in terms of residential construction. The two Ellicott City zip codes combined (21042 and 21043) accounted for the largest fraction of residential building permits in 2014; in contrast there were almost no permits issued for east Columbia (21045).
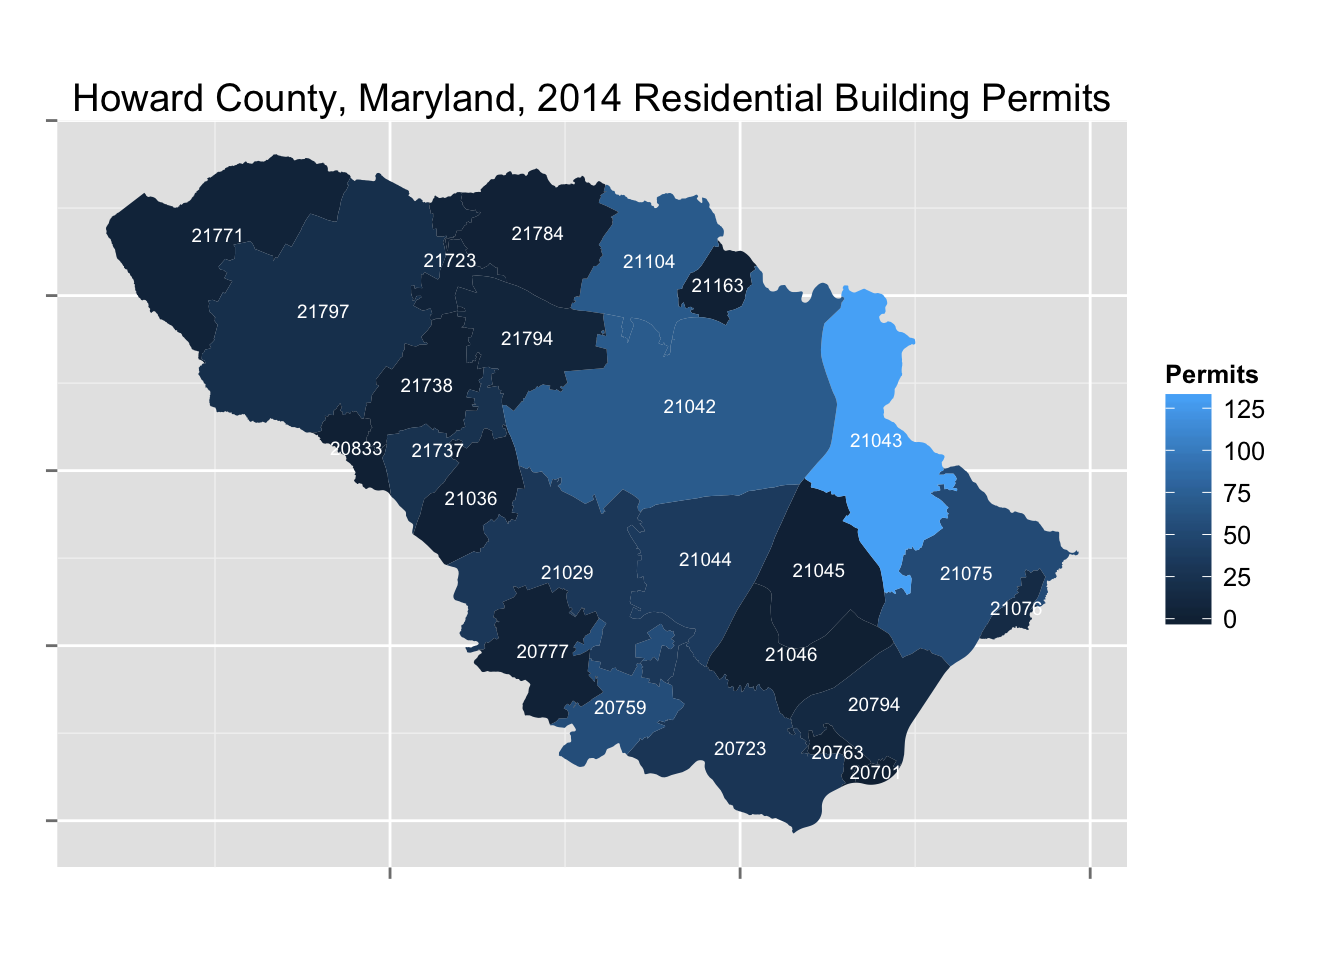
However what I really wanted to create was a map showing exactly where permits were being issued across the county. The Howard County GIS division provides on data.howardcountymd.gov a set of map data for zip codes within Howard County. After doing a bit of research and experimentation, in my third example I was able to use this in conjunction with the building permit data to produce a map that is a nice alternative to the bar chart.
I have to stop here and ask the unspoken question: What’s the point of all this? I’d answer as follows:
First, this shows that releasing government data empowers people to do interesting things with it, especially when combined with free software and easily available online information and training. Maybe everybody isn’t interested in building permit data or any other individual government data set, but I suspect that there are a fair amount of people out there who are, including small businesses, nonprofit organizations, or just individual activists and interested citizens.
Second, I did all this in a way that is completely reproducible by anyone else. How often have you seen a graph or map in a newspaper or government report and wondered, where exactly did that data come from? Wonder no longer: In my examples I start with the raw data as released by Howard County and show all my work in analyzing the data and creating the tables, charts, and maps.
Finally, this is all reusable and adaptable. For example, suppose you have a better source of data on construction activity, perhaps one that gives the actual numbers of residential units, commercial square footage, and so on. You can easily plug that modified data into the analysis steps I’ve documented, and create better versions of the charts and maps in my examples.
You can also reuse the overall technical approach for any type of data tied to a geographic area within Howard County. For example, in addition to zip code areas the data.howardcounty.gov site contains map data for Howard County school districts, election precincts, census tracts, and many other subdivisions of the county. If you have data sets that are based on those subdivisions (for example, vote totals or turnout percentages for precincts) then you can adapt the code I wrote (all of which is in the public domain) to create your own maps showing how that data varies across the county.
The bottom line is that the data is out there for the picking, as are the tools to make sense of it. You just need to spend some time learning how to use them or (if you don’t feel up to the task yourself) finding someone who can. Have fun!