UPDATE 2024/01/04: This post originally appeared on my Civility and Truth Substack newsletter. I’ve moved it to my main site in an effort to collect all of my writing in one place.
After looking at the median household income of Howard County relative to other local jurisdictions, I now look at median home values. As I noted previously, the earliest county-level data I can find dates from 2005 and the beginning of the American Community Survey.
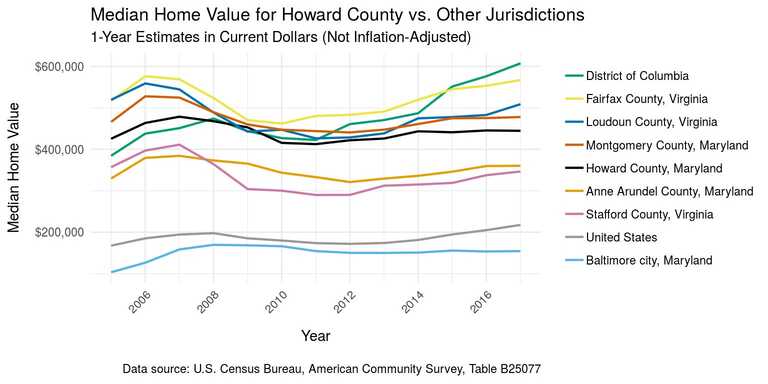
The graph above shows Howard County median home values over time compared to a select set of other jurisdictions. (I chose the same jurisdictions as in my previous analysis of median household income, for the same reasons.)
All values are in current dollars as of the year of the survey. Thus, for example, the values for 2005 are expressed in 2005 dollars, the values for 2006 are in 2006 dollars, and so on. (I did not use inflation-adjusted values because housing costs are themselves a major component of the Consumer Price Index. Multiplying by a CPI deflator would therefore understate any actual rises in home values.)
Here’s some immediate takeaways from the graph above:
- Unlike other counties (not to mention the US as a whole), Howard County home values have not yet fully recovered from the Great Recession, and have been essentially stagnant since 2014. The same is true for Montgomery County and Baltimore city, as well as possibly for Anne Arundel County.
- In contrast, home values in Virginia counties are rising, and in the case of Fairfax County have fully recovered (at least in nominal terms).
- The District of Columbia has experienced a major rise in home values, over 50% since the start of the time period covered in the graph.
- Stafford County, Virginia, has significantly lower home values than Howard County, but a median household income that is essentially equivalent to that of Howard County. (See my previous article.)
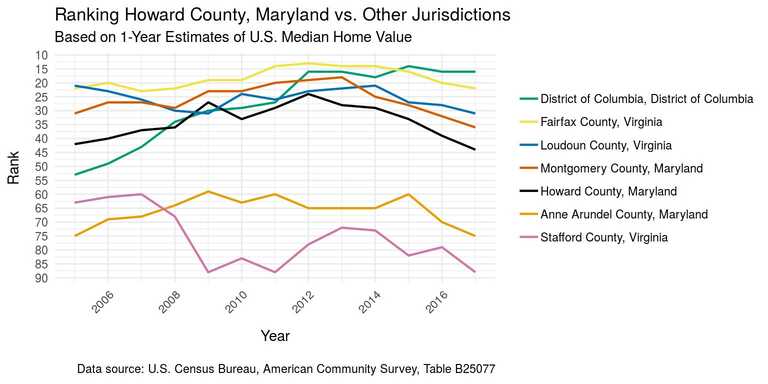
This second graph shows the ranking of Howard County over the years versus the most affluent local jurisdictions. (Note that these rankings do not reflect home values in counties or county-equivalents with populations less than 65,000. These jurisdictions are too small to be included in the American Community Survey 1-year estimates.)
The story is similar to that from the previous graph:
- Howard County has gone from being in the top 25 counties (or county-equivalents) based on median home value to barely being in the top 50. (Its actual rank for 2017 was at number 45.)
- As it did in the median household income rankings, the District of Columbia has come from being out of the top 50 to being in the top 20 in terms of median home value. (Its actual rank for 2017 was at number 16.)
This is consistent with the narrative of major “showcase” cities (DC, New York, San Francisco, etc.) experiencing economic success and an accompanying rise in home prices, while other cities (like Baltimore city) and some suburban areas (like Howard County) languish.
I’ll continue looking at median home values, but may post about something else next week for a change of pace. As always, if you find these posts interesting and useful please tell other people about them (feel free to forward them these emails if you’d like) and encourage them to subscribe to the Civility and Truth mailing list themselves. In the meantime, thanks for being a subscriber and reading this post!

