UPDATE 2024/01/04: This post originally appeared on my Civility and Truth Substack newsletter. I’ve moved it to my main site in an effort to collect all of my writing in one place.
This is a follow-up to my post about home value declines across Maryland, and a companion to my post about median household income within Howard County. For reasons discussed in that post, this analysis covers only the period from 2010 forward, and in particular compares median home values in the 2006-2010 time frame with median home values in the 2013-2017 time frame.
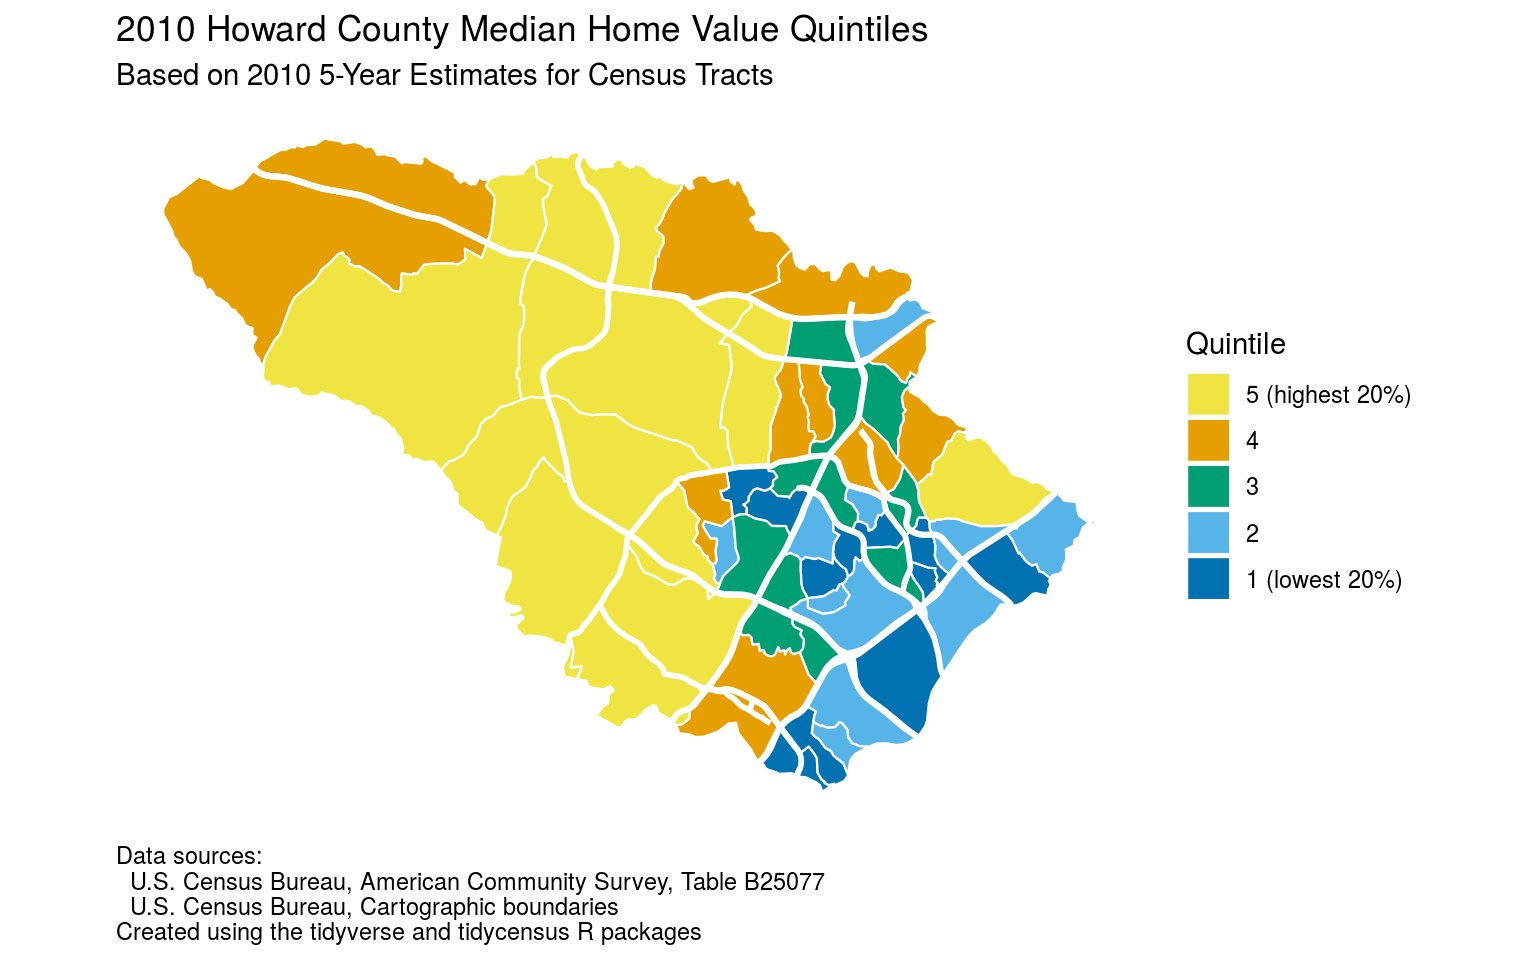
As with median household income, the margins of error for median home value estimates at the census tract level are high, up to 10% or more above and below the estimates themselves. So again I decided to divide the 55 Howard County census tracts into 5 quintiles of 11 tracts each, with quintile 1 containing the 11 census tracts with the lowest median home values, quintile 5 containing the 11 census tracts with the highest median home values, and the other quintiles in between.
The result is the map above, showing which census tracts are in which quintiles according to the 2010 American Community Survey 5-year estimates of median home values. The areas with high and low median home values should not surprise anyone familiar with Howard County real estate: with one exception the census tracts with the highest home values are west of US 29, and the tracts with the lowest median home values are east of US 29 or in Columbia.
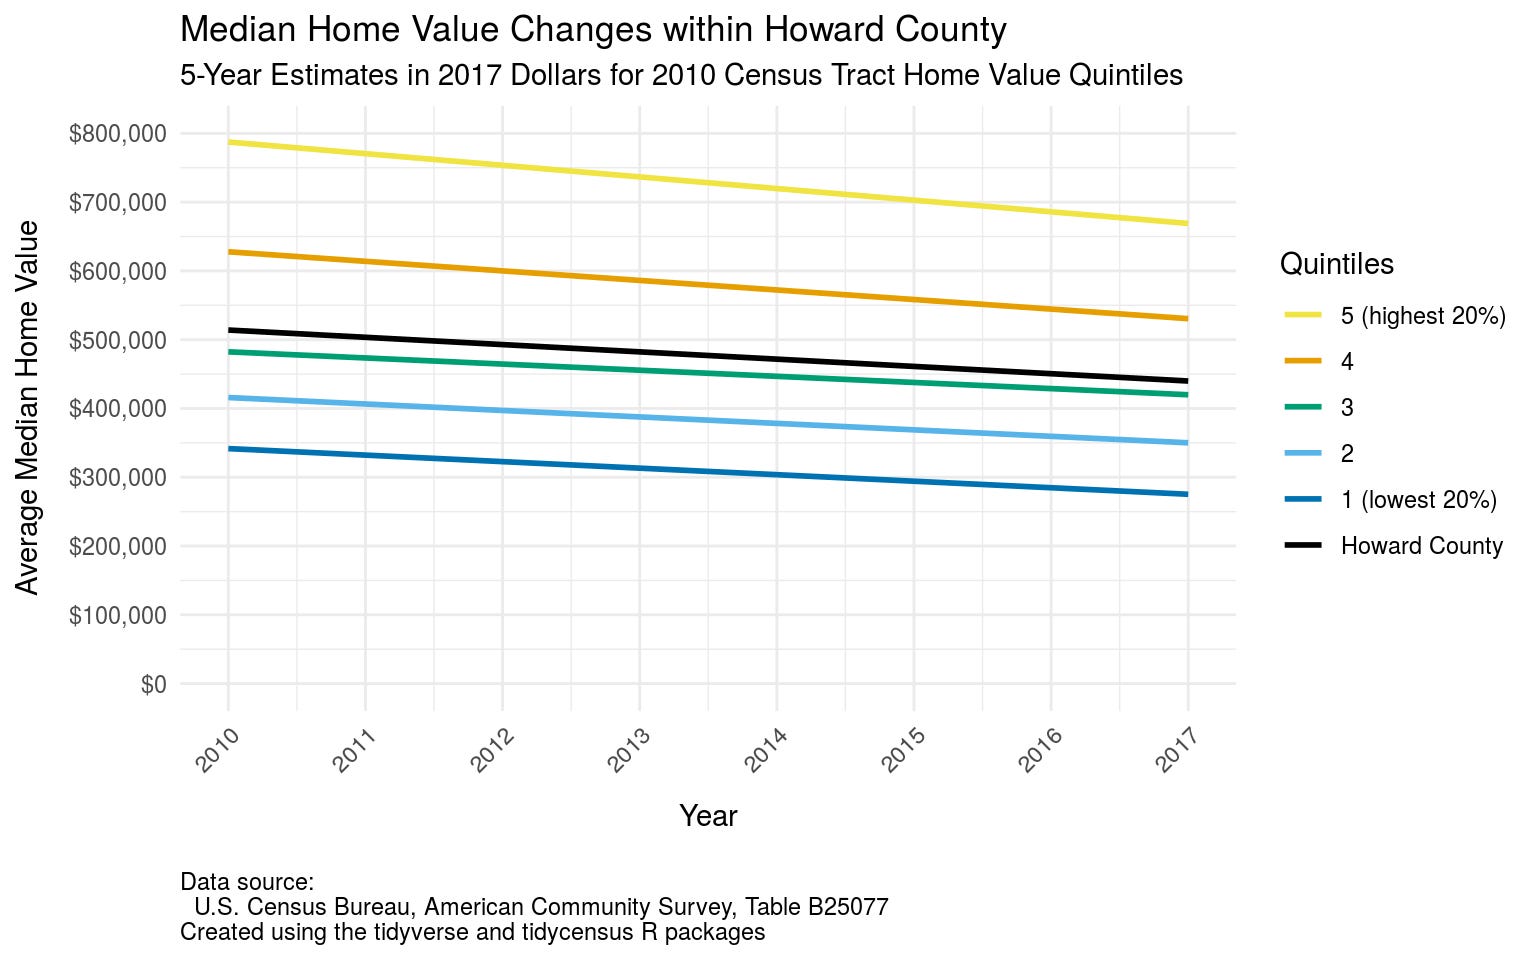
How did this situation change over time? In the graph above I show how the average (inflation-adjusted) median home value for each 2010 quintile changed from 2006–2010 to 2013–2017.
(A reminder here: I write “2010 quintiles” because the census tracts are grouped according to their rank in 2010. If a tract was assigned to, say, quintile 2, in 2010 then it will still be considered in quintile 2 when comparing 2013-2017 to 2006-2010. Also, as noted in the last post averaging median values is not strictly speaking correct, but is the best that can be done in the circumstances.)
From the graph above we see that all quintiles experienced a decline in average inflation-adjusted median home values over the time frame in question. The quintile with the largest decline in percentage terms was quintile 1, for which average inflation-adjusted median home values dropped 19% from 2006–2010 to 2013–2017. The quintile with the smallest decline in percentage terms was quintile 3, with a 13% drop.
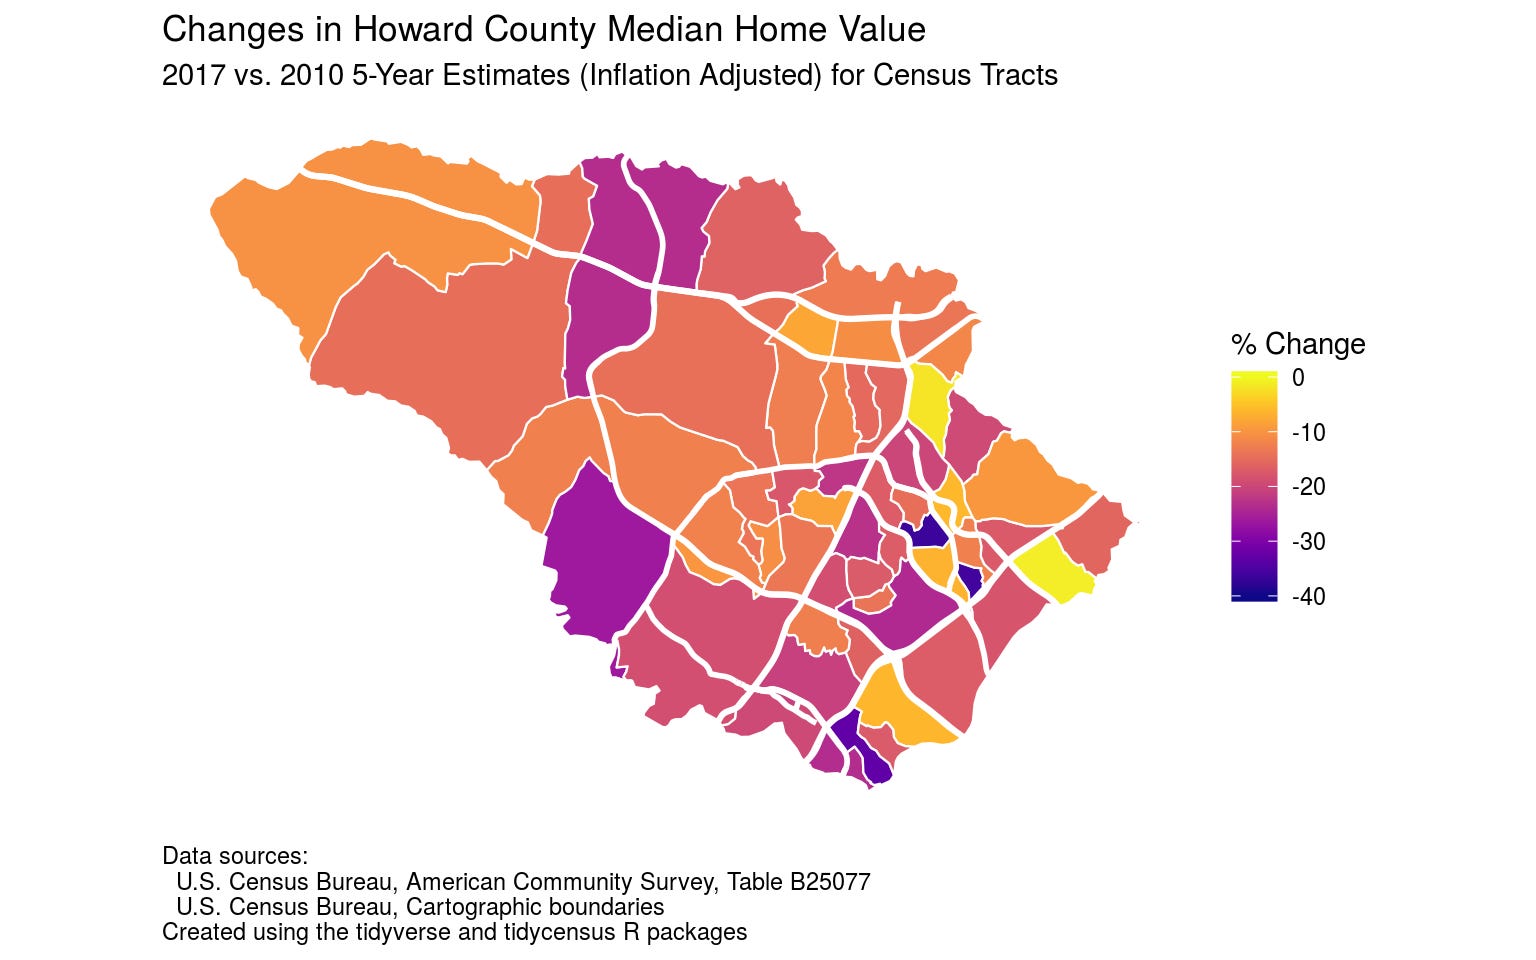
This map is an alternate approach to showing the changes in median home value between the 2006-2010 and 2013-2017 time frames. It shows the percentage declines in median home value for each census tract in Howard County. No census tract had an increase in median home value between the two time frames, and only a couple of census tracts experienced small declines. At the other end of the spectrum a few tracts experienced declines of between 30–40% in median home value.
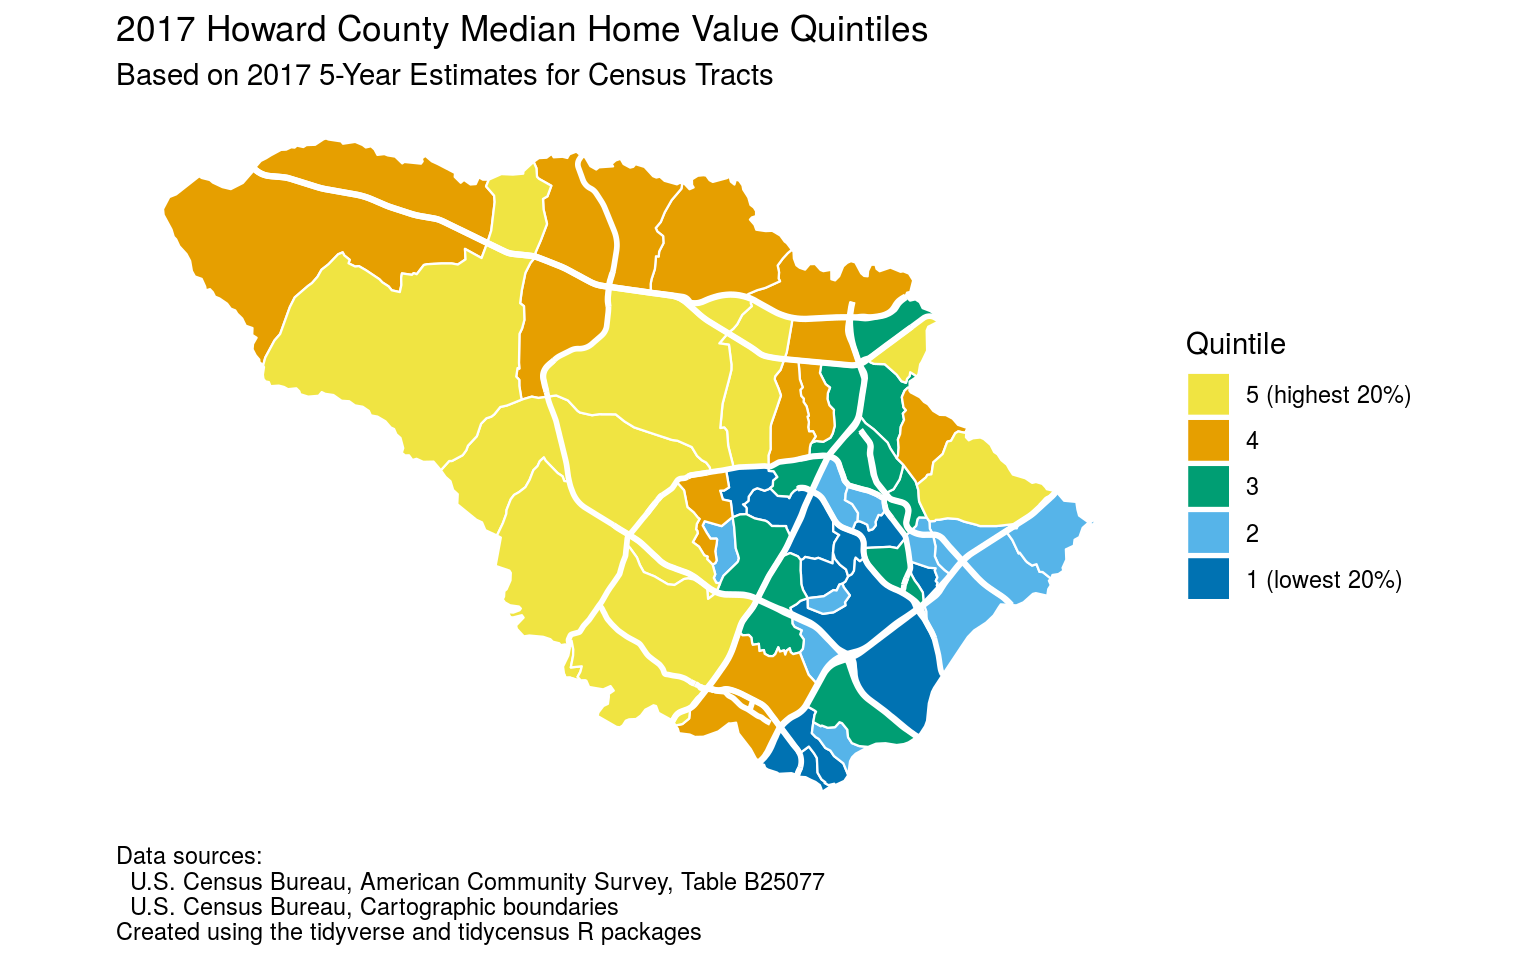
The final map shows the distribution of census tracts among median home value quintiles based on the 2017 ACS 5-year estimates. (In other words, I recalculated which tracts were in the top 20%, etc., based on the newer figures.) The overall picture is similar to that for the 2010 map (high median home values west of US 29, low median home values east of US 29), but some tracts have moved up to a higher quintile or down to a lower quintile. This may be due to how home values fared in those tracts, or simply to random errors in the estimates. (Recall my note above about relatively high margins of error for tract-level estimates.)
For the code and data used to produce the graphs above, see “Howard County median home value trends by census tracts.”
That’s all for this week. A reminder: if you find these posts interesting and useful please tell other people about them and encourage them to subscribe to the Civility and Truth mailing list. Having readers who care enough to subscribe helps motivate me to send these posts out on a regular basis, and the more readers I have the more motivated I’ll be. In the meantime, thanks for reading this post!