UPDATE 2024/01/04: This post originally appeared on my Civility and Truth Substack newsletter. I’ve moved it to my main site in an effort to collect all of my writing in one place.
I’m back this week with some more data analysis and maps, this time regarding the relative cost of housing in Howard County for both renters and homeowners. But before we get to the maps, a brief aside on some ways in which the impact of housing costs can be measured:
The first way is to look at the median percentage of household income taken up by housing costs. That is, for each household, first compute the percentage of its income taken up by housing costs. Then compute the median of all such values, such that half of all households spend more than that percentage and half less.
An alternative measure of housing costs is the percentage of households whose housing costs exceed a certain amount, typically taken to be 30% of household income. Such households are said to be “housing cost burdened.” (Households spending more than 50% of their income on housing are often referred to as “severely burdened.”)
Finally, others have suggested looking at residual income, that is, how much income households have left over after paying for housing.
For this analysis I use the median percentage of housing costs relative to income, mainly because these estimates are directly available at the census tract level in the American Community Survey 5-year estimates. (I may do an analysis based on housing cost burden in my next post, and am looking further at how one might do at least a simple form of residual income analysis.)
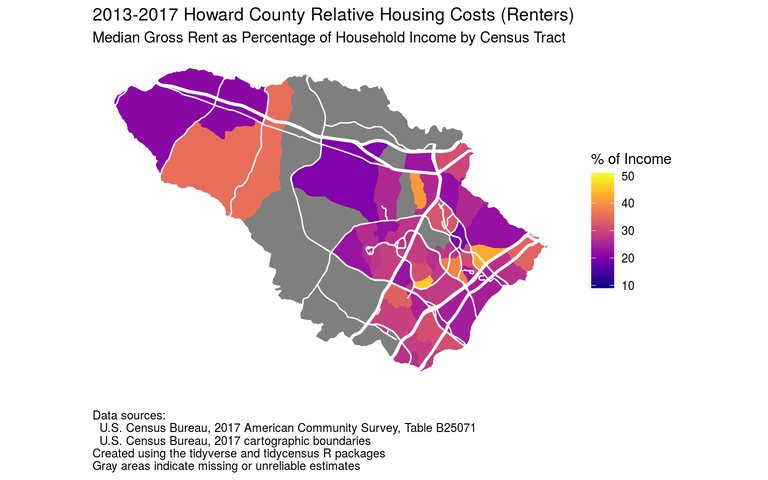
Anyway, back to the map above: It shows for each census tract in Howard County the median percentage of household income spent on “gross rent”—rent plus utilities and fuel—in the 2013–2017 timeframe. (There are lots of gray areas on this map and one of the maps below because for some census tracts there were too few renters or homeowners to calculate an estimate, or the estimates were too unreliable.)
It looks if there are a number of places in Howard County where people spend fairly high percentages of their household income on rent and related expenses. Most of these appear to be in Columbia and eastern Howard County, but there’s also an area in western Howard County where the typical renter looks to be housing cost burdened.
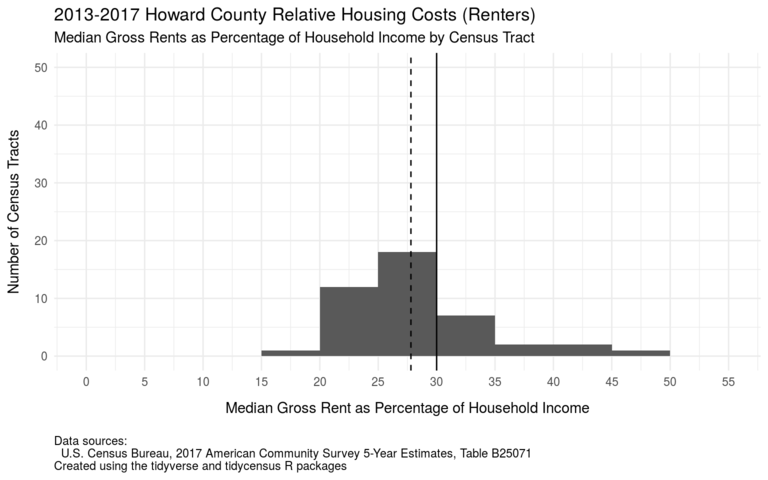
The histogram above shows a different view of the same data. It shows the number of Howard County census tracts falling into different categories: median percentage of rent relative to income between 15% and 20%, between 20% and 25%, and so on. (Again I’ve omitted census tracts with no estimates or unreliable estimates.) The dashed vertical line shows the median percentage of rent to income for all of Howard County (28%), and the solid vertical line shows the 30% figure above which a household is considered to be housing cost burdened.
As noted above, there are a lot of census tracts in Howard County where the median household spends more that 30% of household income on rent and related expanses.
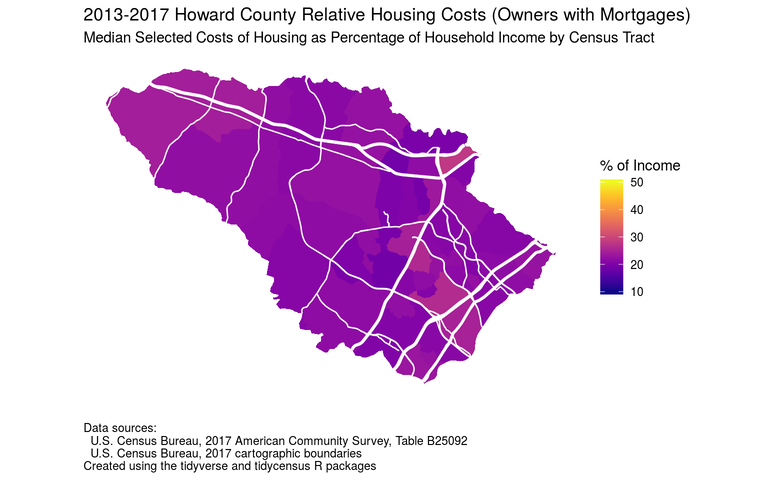
The next map has the same color scale, but shows the median selected costs of housing as a percentage of household income for homeowners who have a mortgage. (“Selected costs of housing” includes not only the mortgage payments but also utilities, insurances, taxes, and condo fees—which would appear to include Columbia Association annual charges.)
Based on this map it appears that typical homeowners in Howard County with mortgages generally spend relatively less on housing than renters.
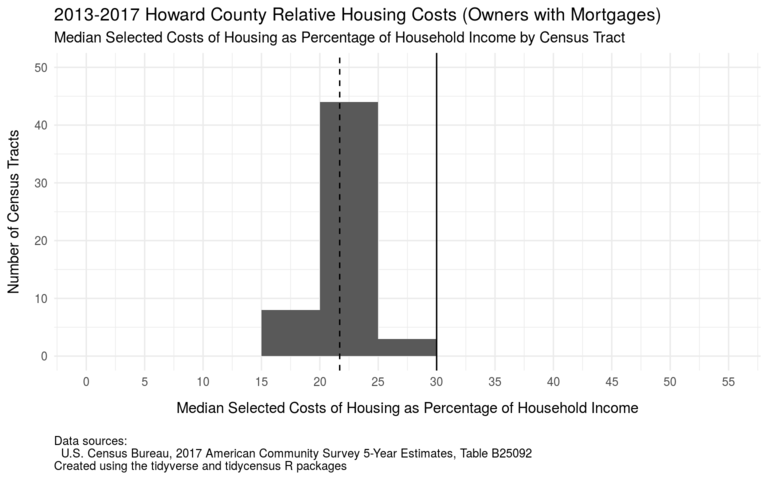
The histogram above confirms this initial impression: In all Howard County tracts with valid estimates median homeowners with mortgages pay less than 30% of household income in housing costs. The median percentage of housing costs to income for the county as a whole was 22% for homeowners with mortgages in the 2013-2017 timeframe, significantly lower than the 28% figure for renters.
The data as presented don’t really explain this difference: it could be due to relatively higher rents and related expenses for renters, or relatively lower household incomes for renters, or both. (And relatively lower household incomes in turn could be due to lower incomes in general, or fewer numbers of workers per household.) This is a possible subject for future posts.
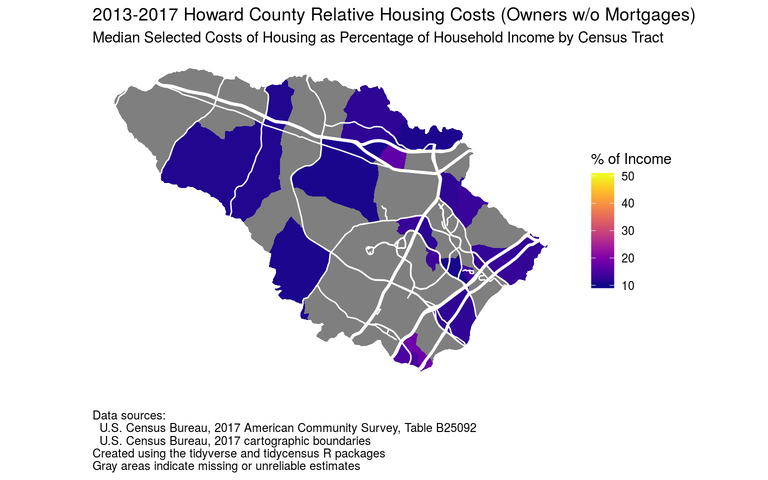
The final map shows the median selected costs of housing as a percentage of household income for homeowners who do not have a mortgage. These households presumably consist of older people who’ve paid off their mortgages, people wealthy enough to pay cash for their homes, or people who’ve inherited homes from their parents. There are relatively few of these people, so most census tracts do not have reliable estimates for their housing costs.
These households appear to be in even better shape than homeowners with mortgages: their median percentage of income spent on housing is fairly low across the entire county.
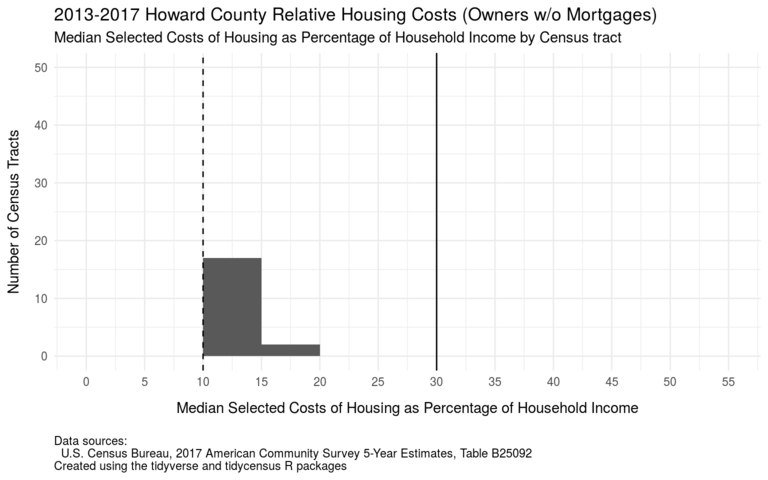
The final histogram confirms this: In almost all census tracts the median percentage of household income spent on housing by homeowners without mortgages is less than 15%. The median percentage for the county overall is 10%.
So, what does this all mean?
People in all three categories receive government subsidies of one sort or another: renter can be eligible for housing choice vouchers (also known as Section 8 vouchers), homeowners can deduct mortgage interest and real estate taxes (although real estate taxes are no longer deductible on Federal tax returns), and older homeowners can get additional help with housing costs (for example, the Howard County senior tax credit) even if they don’t have a mortgage.
After taking all those subsidies into account, it appears that relatively speaking renters are worse off in Howard County than homeowners. One way to address this imbalance would be to provide further subsidies to renters, whether at the county, state, or national level. Another way would to increase the stock of affordable rental housing, whether through a specific focus on building below-market-rate units, or by building more apartments and other rentable housing in general.
How best to provide affordable housing is a topic of great debate in Howard County and elsewhere. I don’t have a definitive opinion on this matter yet, so I’ll sign off this week with the promise that I’ll try to look at this issue in more detail later when I have time to do more research. For now you can check out the code and data behind this post in the article “Howard County, Maryland, relative housing costs by census tract.”
As always, if you find these posts interesting and useful please tell other people about them and encourage them to subscribe to the Civility and Truth mailing list. Having readers who care enough to subscribe helps motivate me to send these posts out on a regular basis, and the more readers I have the more motivated I’ll be. In the meantime, thanks for reading this post!
