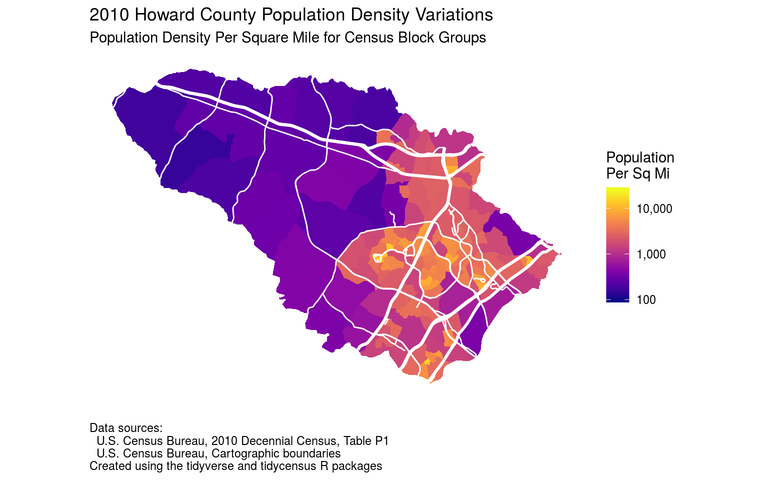
A map of population density of each of the 154 census block groups in Howard County, Maryland. Click for a higher-resolution version. Map by Frank Hecker, made available under the CC 1.0 Universal Public Domain Dedication.
tl;dr: Some areas of Howard County are over a hundred times more densely populated than others.
A long-time theme in writings about Howard County is the distinction between the more densely populated suburban and semi-urban areas like Columbia and the less densely populated rural areas in the western part of the county. This has implications for issues from political affiliations to school redistricting, and of course for affordable housing as well.
In this post I’m going to ignore those issues though, and just look at the simple facts about density variation across the county. The map above shows density variations as of the 2010 census—a data source I chose because it contains accurate population counts at a fairly fine-grained level.1 The map shows population densities (people per square mile) for each of the census block groups within the county.
A census block group is a geography defined by the US Census Bureau that is one level below a census tract. There are currently 154 census block groups in Howard County, compared to 55 census tracts. The smallest geography in US Census data is the census block, one level below the census block group. There are currently 4,845 census blocks defined for Howard County.
Census tracts are relatively large, about 6,000 people or so on average in Howard County. On the other hand, census blocks are too small: more than half of all census blocks in Howard County contained no people at all in the 2010 census.
Census block groups are a nice “not too large, not too small” subdivision of the county’s overall area. In 2010 the least populated census block group contained 645 people, while the most populated census block group contained 3,632 people. The smallest block group covered an area of 0.1 square miles (about 64 acres), while the largest block group covered an area of 13.4 square miles.
A typical census block group is thus comparable in both size and population to a traditional village or small town. It is large enough to be a recognizable “place,” but small enough to have its own identity distinct from that of other places in the county.
What about density? One of the most surprising things to me in doing this analysis was the wide variation in population density across the county. Population density in 2010 varied from a low of 151 people per square mile to a high of 15,181 people per square mile, a difference of two orders of magnitude. In comparison, overall population density for the county in 2010 was 1,144 people per square mile (287,085 people divided by the county land area of 251 square miles).

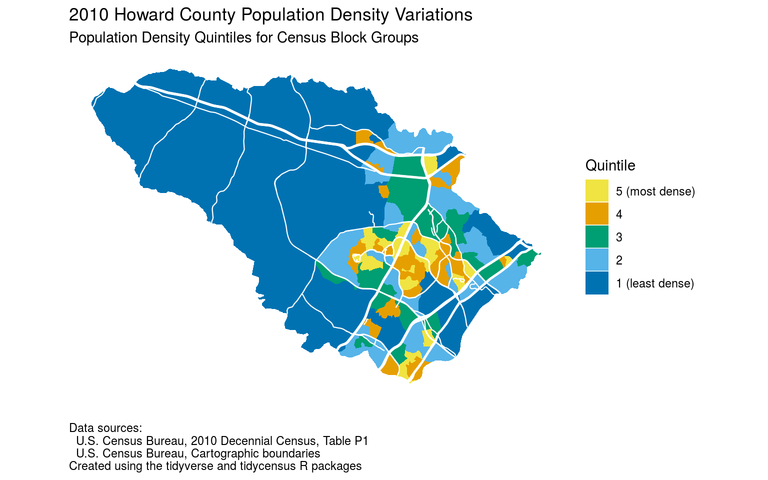
The 154 census block groups in Howard County, Maryland, divided into five different groups based on their population density in the 2010 census. Click for a higher-resolution version. Map by Frank Hecker, made available under the CC 1.0 Universal Public Domain Dedication.
The map above is a variation on the first map. It is based on the same 2010 census data, but divides the census block groups into five groups (or “quintiles”) of 31 block groups each (or 30, for the highest quintile). This map shows much more clearly that almost all of the census block groups with the highest population density are in Columbia and eastern Howard County, and almost all of the census block groups with the lowest population density are in western Howard County.
(Some of the major exceptions are areas like Columbia Gateway and the light industrial districts east of I-95 that have little or no residential construction. Here “low population density” is not the same as “not built up.”)

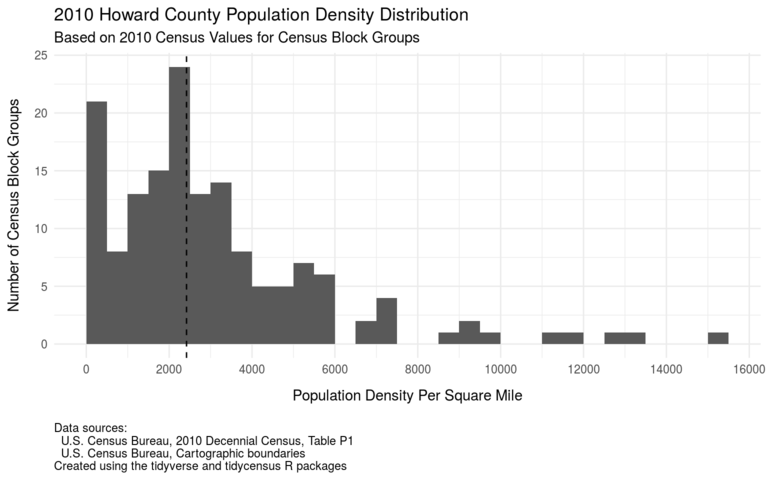
A histogram showing the number of census block groups in Howard County, Maryland, that fall into certain ranges of population density. Click for a higher-resolution version. Graph by Frank Hecker, made available under the CC 1.0 Universal Public Domain Dedication.
As shown in the above histogram, and also in the first map above, there are many census block groups in Howard County that had a population density of less than 500 people per square mile in 2010. At the other end of the spectrum a few census block groups had population densities of well over 10,000 people per square mile.
The largest number of census block groups fell into the range of 2,000–2,500 people per square mile; the typical (median) block group had a population density of about 2,400 people per square mile. (This is different from the overall population density of Howard County of 1,441 people per square mile quoted above.)
To help think about what these numbers mean, consider a square mile, about 640 acres. Suppose we have a few neighborhoods of single-family houses on 3- to 4-acre lots, with three or four people per house. With 50–100 total houses we have a total of 150–400 acres and 150–400 people. Throw in two or three 100–150 acre farms plus road surfaces and open spaces and you’d have a typical Howard County rural census block group with a population density of 200–500 people per square mile.
Now suppose instead we have 0.1 square miles, about 64 acres, occupied by five or six apartment buildings with 50–100 units each, with two to three people per unit. Now we have 500–1,800 people total in that 0.1 square mile area, for a total of 5,000 to 18,000 people per square mile—in other words, a typical semi-urban setting in Columbia or eastern Howard County.

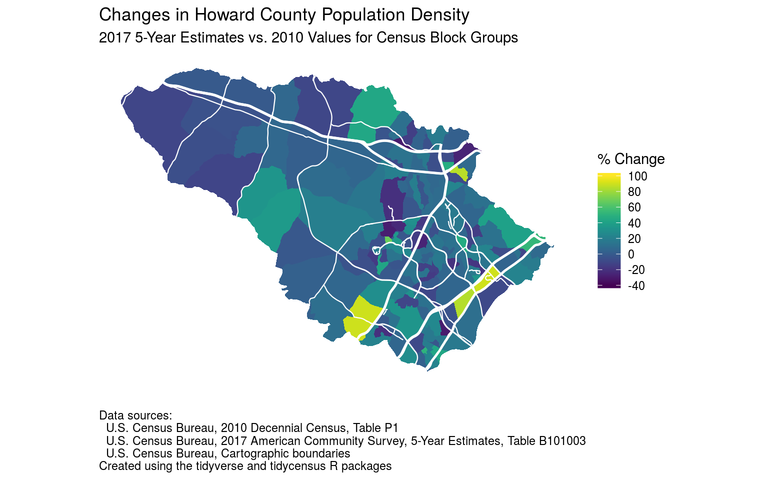
A map showing estimated changes in population density of census block groups in Howard County, Maryland, between the 2010 census and the 2013–2017 timeframe. Click for a higher-resolution version. Map by Frank Hecker, made available under the CC 1.0 Universal Public Domain Dedication.
How is population density in the various parts of Howard County changing over time? It’s hard to get a good picture of this in between censuses, because the available population estimates are from surveys taken over multiple years (from 2013 through 2017 for the latest available data) and have fairly high margins of error at the level of census block groups (up to 30% or more above or below the estimates themselves).
The map above is an attempt to show density changes from the 2010 census forward, using the American Community Survey 2017 5-year estimates. As with population density itself, there is wide variation in population density changes.
A few areas stand out as having significant increases in population density, from 50 to 100%. These appear to be include the Maple Lawn Farms development in Fulton as well as adjacent neighborhoods south of MD 216, areas along US 1 south and north of MD 175, and areas near downtown Ellicott City.
Other areas apparently experienced decreases in population density. Assuming that the number of housing units did not decrease in those areas, this likely was caused by the number of people per household decreasing, for example due to children leaving families and “empty nesters” remaining. (Additional census data, for example on household size and the ages of household members, should be able to confirm or refute this idea.)
To sum up: we may argue about how the density divide in Howard County came about and what it all means, but I don’t think there’s any dispute that it exists. It is especially clear in western Columbia, where the drop off in density west and north of MD 108 and (to a lesser extent) south of MD 32 is particularly dramatic. It’s also apparent that new development and demographic changes in family size are having disparate impacts across the county.
Combining this density data with information on socioeconomic and political variables could uncover some interesting patterns. Hopefully I’ll have time in the future to look at this.
Further exploration
For more on how I created the maps and histogram above, see the following:
- “Howard County density trends by census block groups” shows the R code used to produce these and other graphs.
- My hocodata code repository includes copies of the R Markdown files for this and another analyses. (Look in the “affordability” subdirectory.)
- If you sign up for a free account on the Rstudio.cloud service you can open and make a copy of my hocodata project for this and other analyses, and try your hand at it yourself. (Again, look in the “affordability” subdirectory, and check out the RStudio primers to learn how to use the system.)
I also did two other articles focusing specifically on population density in Columbia and Ellicott City for my (now deprecated) Civility and Truth newsletter.
I included some major Howard County highways on the map to help readers orient themselves: interstates, US highways, Maryland numbered routes, and roads with “Parkway” in their name. ↩︎