UPDATE 2024/01/04: This post originally appeared on my Civility and Truth Substack newsletter. I’ve moved it to my main site in an effort to collect all of my writing in one place.
This is a brief follow-up to last week’s post. I had hoped to be able to take a closer look at density variations in Columbia and Ellicott City. However I haven’t yet found a good way (at least via the Census API) to get a list of census block groups or census blocks for the Columbia and Ellicott City CDPs. (“CDP” or “Census Designated Place” is US Census Bureau jargon for a population center that’s unincorporated.)
I also happened to think about whether the census block group boundaries had changed from 2010 to 2017. After looking at this I concluded that they probably had not, but this took a while to nail down.
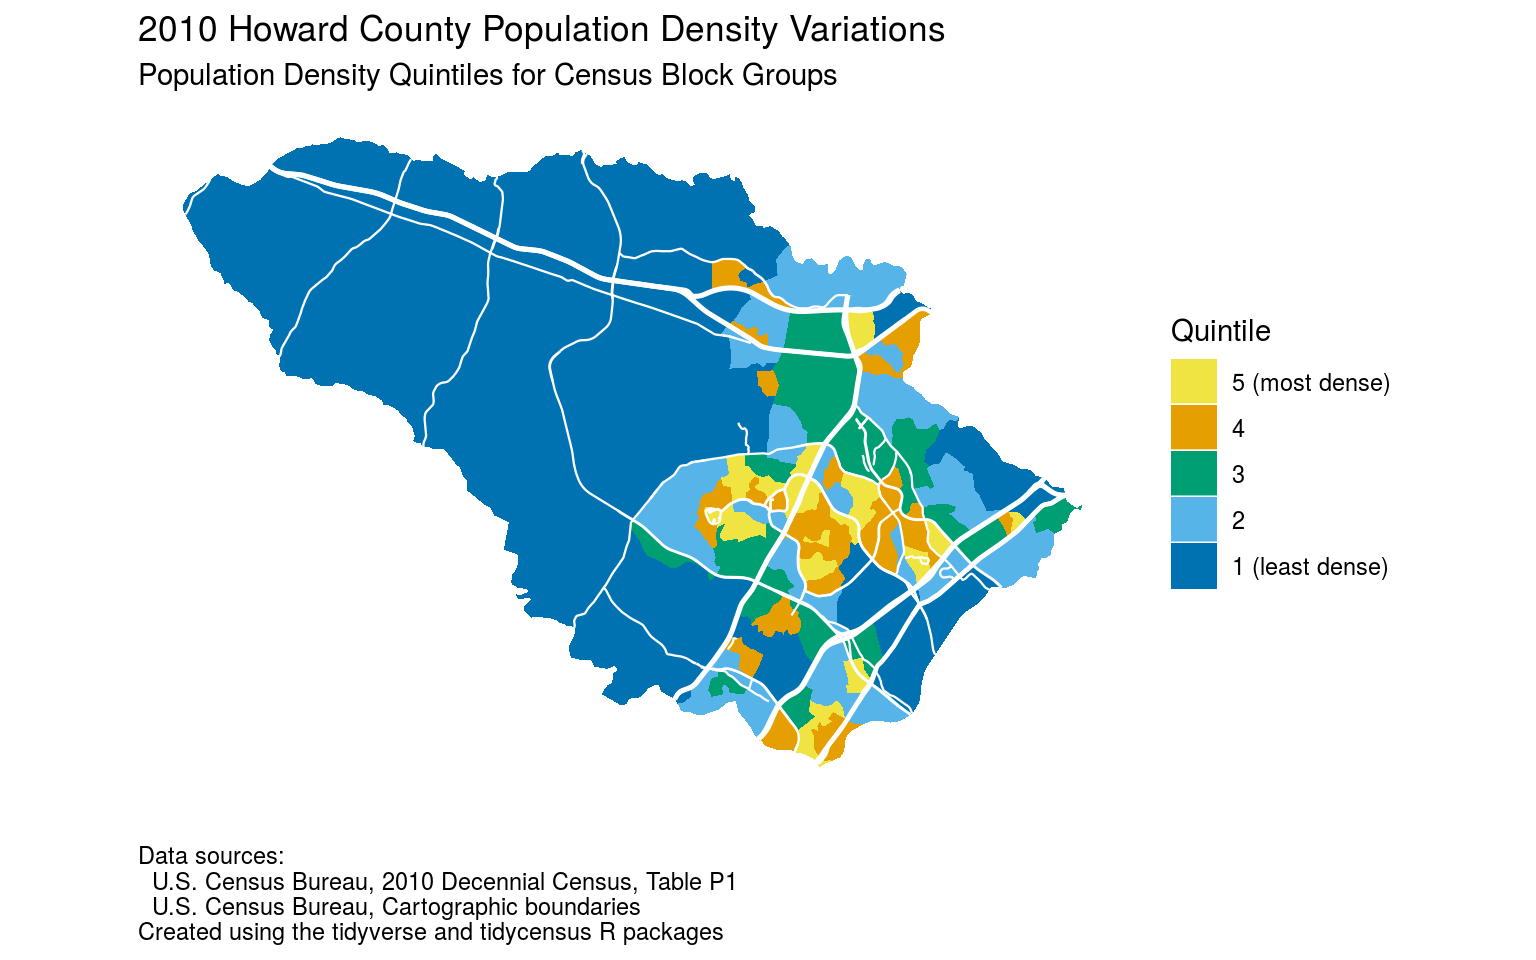
The one new thing I did was to produce a map of density variations based on the quintiles the various census block groups fell into. In other words, in the map above the census block groups in dark blue (quintile 1) are the 20% of all census block groups with the lowest population density in 2010, while the census block groups in yellow (quintile 5) are the 20% of all census block groups with the highest population density in 2010. The other areas in light blue, green, and orange (quintiles 2, 3, and 4 respectively) are intermediate between those two groups.
I think this map does a slightly better job of letting you tell at a glance which are the most dense and least dense parts of the county, as well as which areas are roughly in the middle in terms of density.

Here’s a similar map using the 2017 ACS 5-year estimates, which cover the 2013-2017 timeframe. At first glance I can’t see any differences between this map and the prior map. This means that even though some areas of the county may have experienced changes in population density between 2010 and 2013-2017, the changes weren’t large enough to make any real difference in the overall density picture.
I’m going to try again to do density maps for Columbia and Ellicott City. In the meantime, see the revised version of “Howard County density trends by census block groups” for the code behind the maps above.
That’s all for this week. A reminder: if you find these posts interesting and useful please tell other people about them and encourage them to subscribe to the Civility and Truth mailing list. Having readers who care enough to subscribe helps motivate me to send these posts out on a regular basis, and the more readers I have the more motivated I’ll be. In the meantime, thanks for reading this post!