UPDATE 2024/01/04: This post originally appeared on my Civility and Truth Substack newsletter. I’ve moved it to my main site in an effort to collect all of my writing in one place.
Hey! I finally managed to figure out to get a list of census block groups or census blocks for the Columbia CDP. (As a reminder, “CDP” or “Census Designated Place” is US Census Bureau jargon for a population center that’s unincorporated.) So now I can bring you some density maps that zoom in to focus on just Columbia as opposed to all of Howard County.
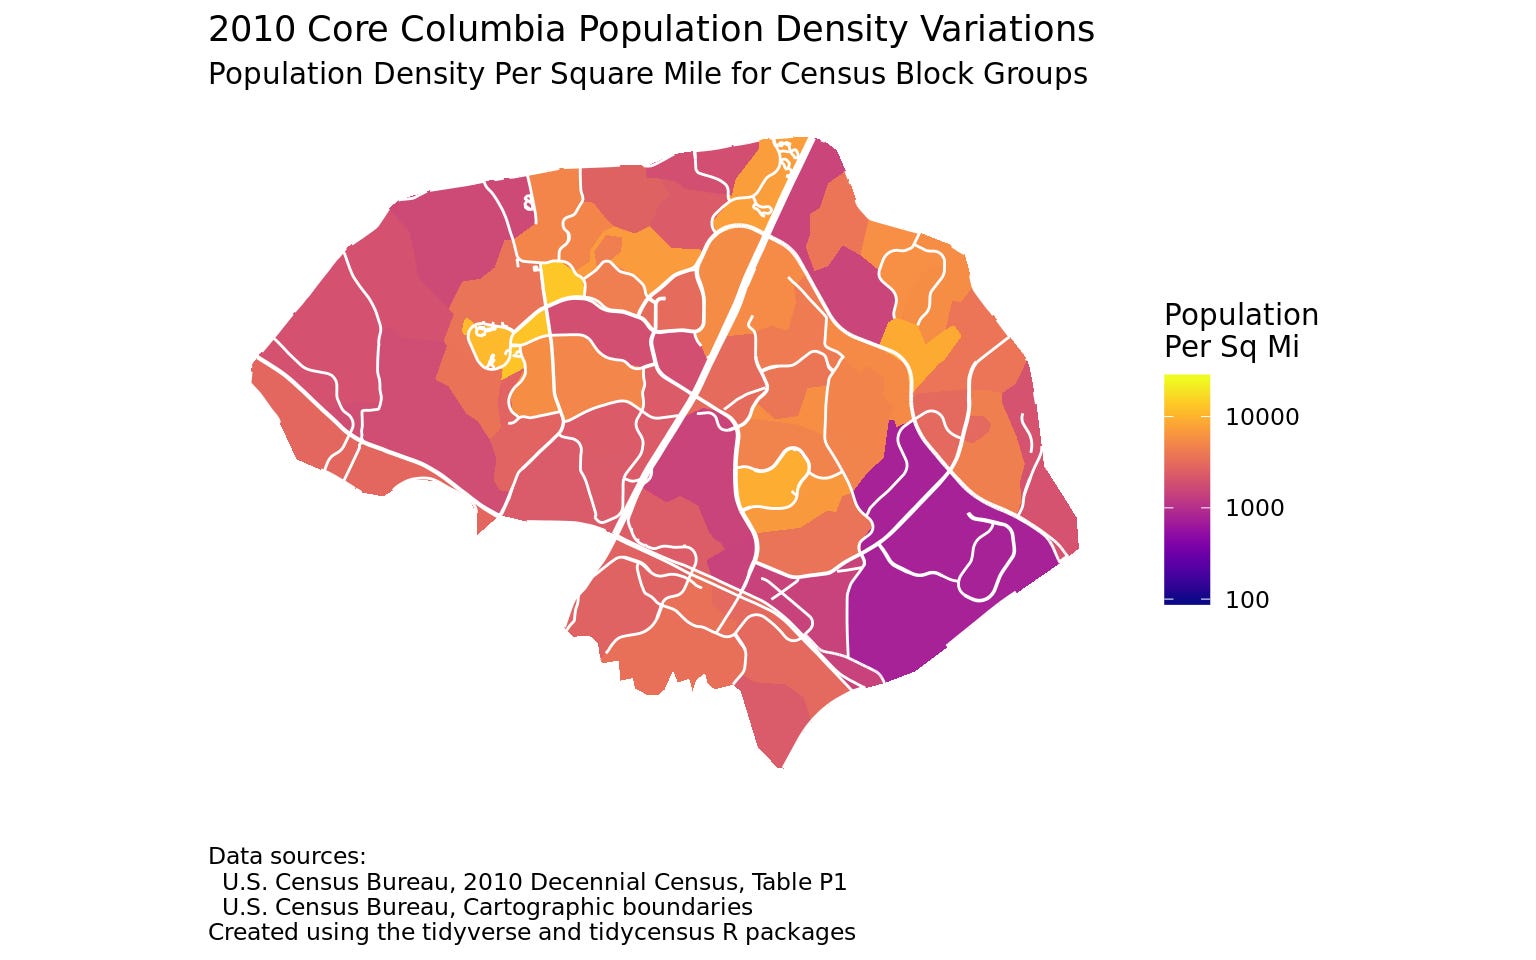
The map above shows population density variations as of the 2010 census for the various census block groups that are wholly or mostly within the Columbia CDP. (Some census block groups contain only a small portion of the Columbia CDP. I omitted them from the map.) There are 54 such census block groups, as compared to 154 census block groups within the county. Thus from this point of view Columbia accounts for about a third of Howard County.
As I mentioned previously, census block groups are a nice “not too large, not too small” subdivision. In 2010 the least populated census block group in Columbia contained 645 people, while the most populated census block group contained 3,632 people. The smallest Columbia census block group covered an area of 0.12 square miles (about 79 acres), while the largest block group covered an area of 3.11 square miles.
A typical census block group is considerably smaller than a Columbia village: since there are nine Columbia villages, each village would contain about 6 census block groups on average if they were equally distributed.
In the map above I’ve shown more roads than in my previous maps, to help orient you vis-a-vis the various parts of Columbia. I thought about also superimposing the boundaries for the various Columbia villages (data that’s available on the Howard County GIS site), but ran out of time to make this work.
The main take-away from the map above is the areas of Columbia that are relatively high-density vs. relatively low-density. Relatively high-density areas include portions of Harpers Choice and Owen Brown villages, presumably due to apartment complexes there. In contrast the Columbia Gateway area is primarily office space and thus low-density in terms of residential population.
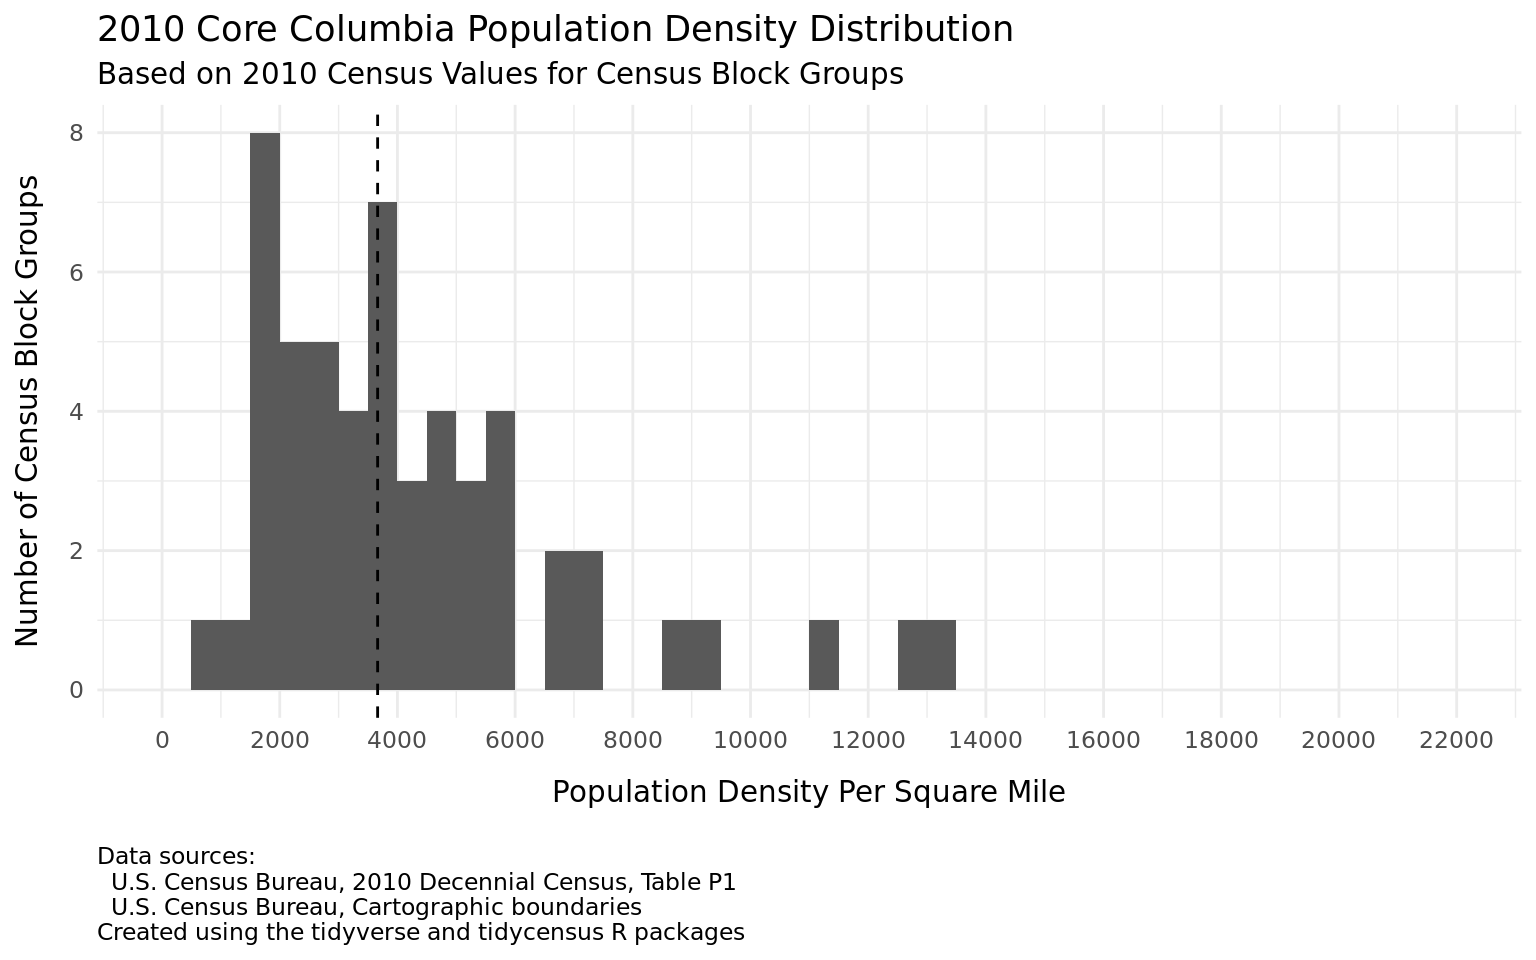
The histogram shows the distribution of density among the various Columbia census block groups in 2010. Density varied from a low of 761 people per square mile to a high of 13,285 people per square mile, a difference of over an order of magnitude. Overall population density for Columbia in 2010 was 3,187 people per square mile.
As a comparison, the lowest density Howard County census block group in 2010 had 151 people per square mile, and the highest density block group had 15,181 people per square mile. Overall population density for the county in 2010 was 1,144 people per square mile. Thus the least-dense Columbia census block group was over five times as dense as the lowest-density Howard County block group, and Columbia as a whole was about three times more densely populated than the county as a whole.
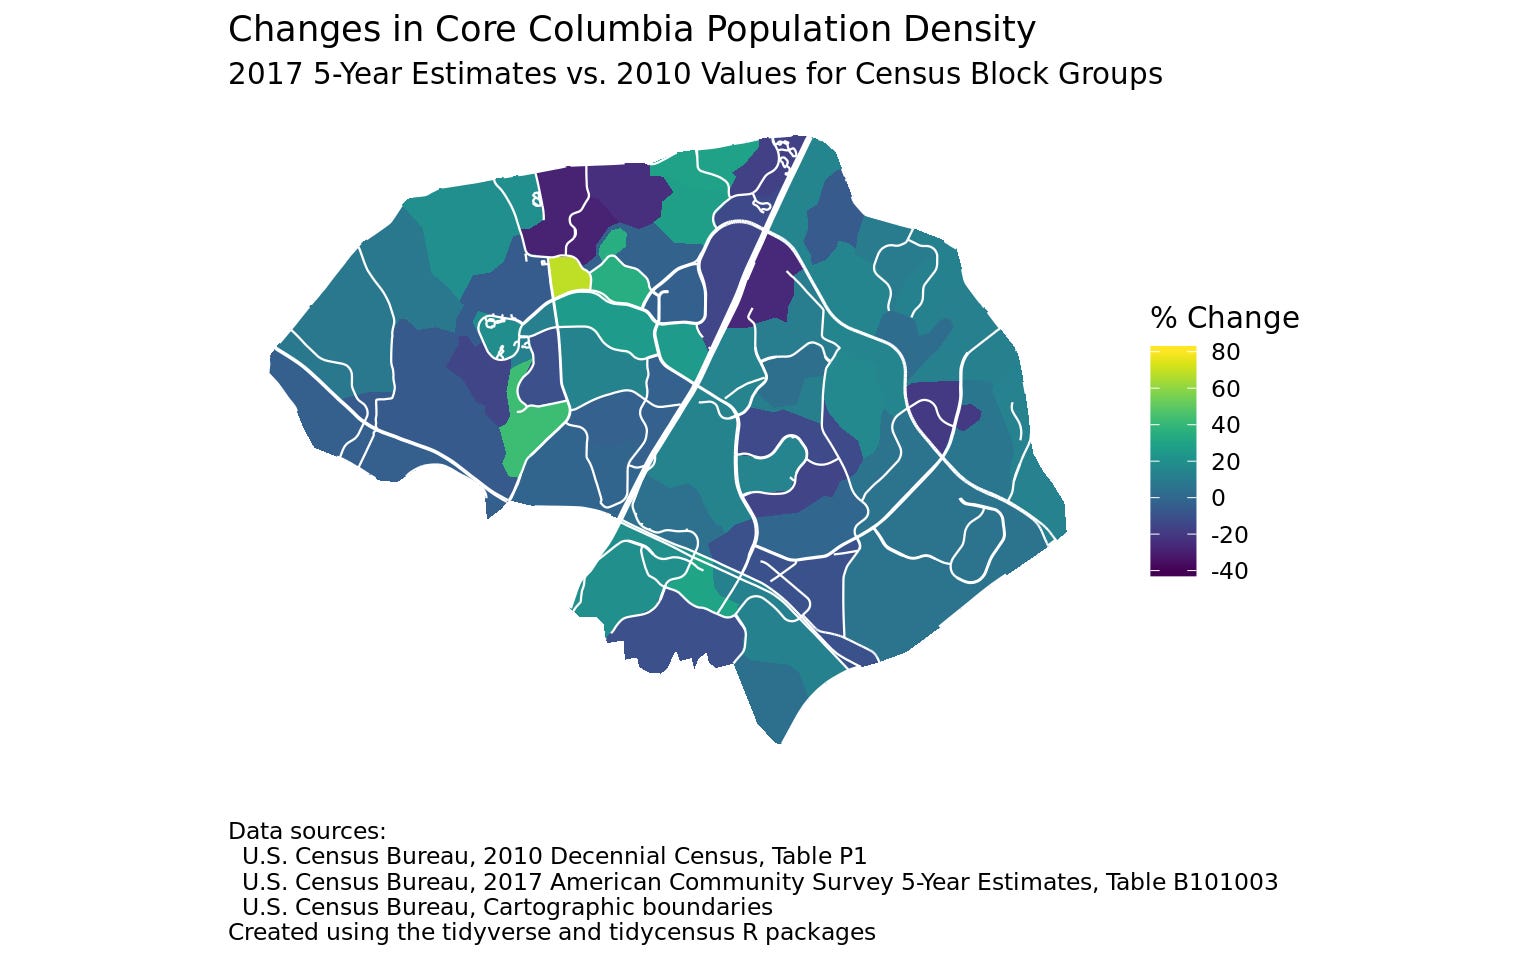
The next map shows changes in population density in Columbia between the 2010 census and the 2017 American Community Survey 5-year estimates (which reflect surveys done in 2013 through 2017). Even over this relatively short period we can see significant decreases in density in the area of Harpers Choice village off Harpers Farm Road in northwest Columbia, and a increase in density in the area just south of there, north of Little Patuxent Parkway and east of Cedar Lane. I don’t know if there’s been any change in the total number of housing units in those areas, so my initial guess is that these changes are due to changes in household size: older children moving out on the one hand, and more young children on the other.
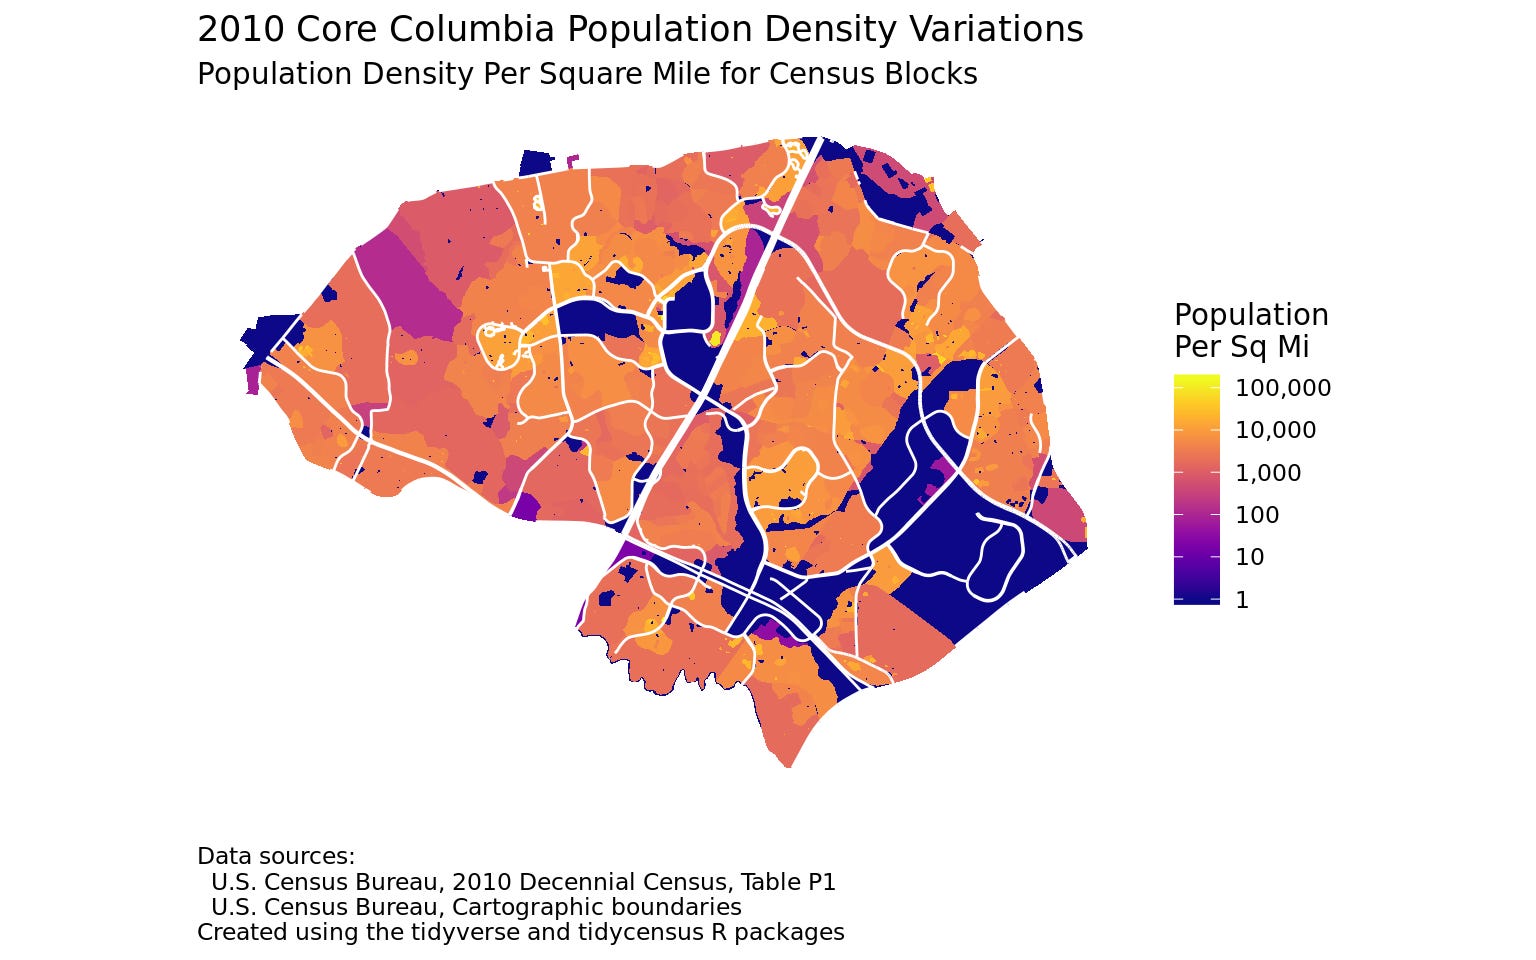
For my final map I decided to map density variations at the level of census blocks. This uses population data available for the 2010 census but not for the American Community Survey.
Census blocks are very small: there are 1605 census blocks in the Columbia CDP, with an average area of 0.02 square miles (about 13 acres). In 2010 over half of the census blocks contained no people at all, and the average population of a block was only 62 people; the largest block contained 2,696 people.
Because of the small size of census blocks the corresponding population density can be very high if the block mainly contains apartment complexes. In 2010 there were several census blocks in Columbia with population densities over 50,000 people per square mile, and a few over 100,000 people per square mile. At the other end of the spectrum the majority of census blocks in Columbia contain no people and thus have a population density of zero.
Because of this wide distribution of population densities I don’t think the block-level map is that useful for looking at population densities in residential areas. However on this map it’s very easy to pick out the parts of Columbia that are devoted to office, retail, or industrial uses (in dark blue). This includes the Columbia Gateway and Dobbin Road areas on either side of Snowden River Parkway, the areas along Broken Land Parkway, the Mall at Columbia and the future Merriweather District, and the area around the hospital and Howard Community College.
UPDATE: I was able to resolve the problems that were preventing me from publishing the underlying code and data for this post. See the document “Columbia, Maryland, population density.”
That’s all for this week. A reminder: if you find these posts interesting and useful please tell other people about them and encourage them to subscribe to the Civility and Truth mailing list. Having readers who care enough to subscribe helps motivate me to send these posts out on a regular basis, and the more readers I have the more motivated I’ll be. In the meantime, thanks for reading this post!