UPDATE 2024/01/04: This post originally appeared on my Civility and Truth Substack newsletter. I’ve moved it to my main site in an effort to collect all of my writing in one place.
I’m back again with more population density maps, this time for Ellicott City—or, more precisely, the Ellicott City Census Designated Place or CDP.
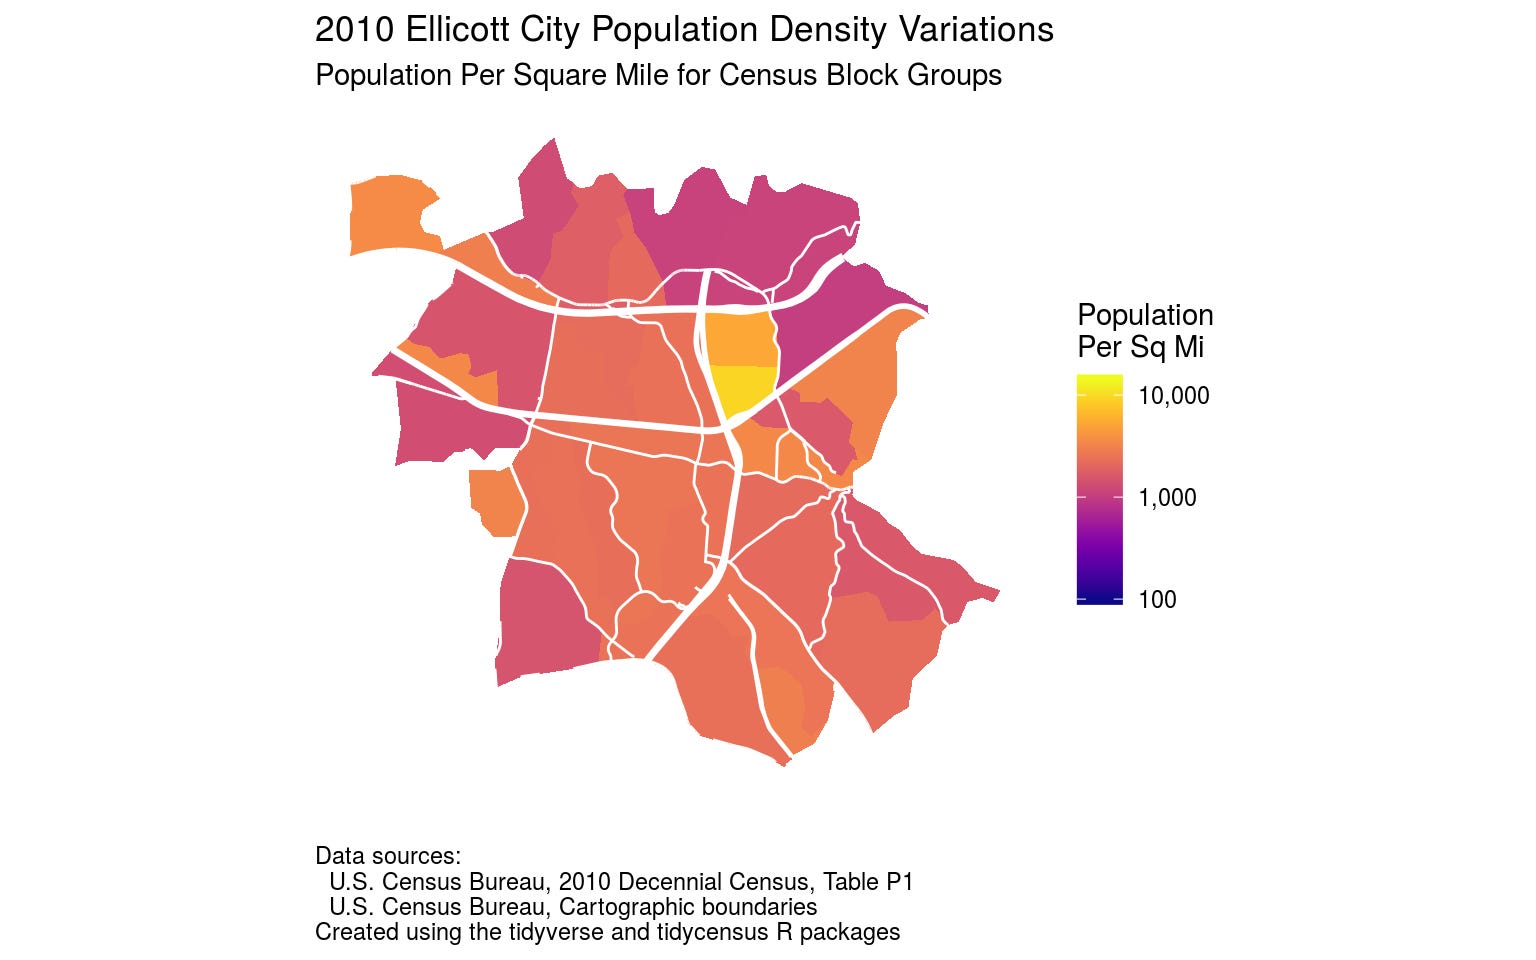
The map above shows population density variations as of the 2010 census for the various census block groups that are wholly or mostly within the Ellicott City CDP. There are 34 such census block groups, compared to 54 census block groups for Columbia or 154 census block groups within the county, with Ellicott City thus accounting for about a fifth of Howard County. (The 2010 population of 64,245 for these census block groups is also almost a fifth of the county’s total 2010 population.)
The main take-away from the map above is that most of Ellicott City has pretty much the same population density: it has less multi-unit housing than Columbia, and fewer large lots with single-family homes than western Howard County. (The major exception is the area east of US 29 between US 40 and I-70, which contains a number of apartment complexes.)
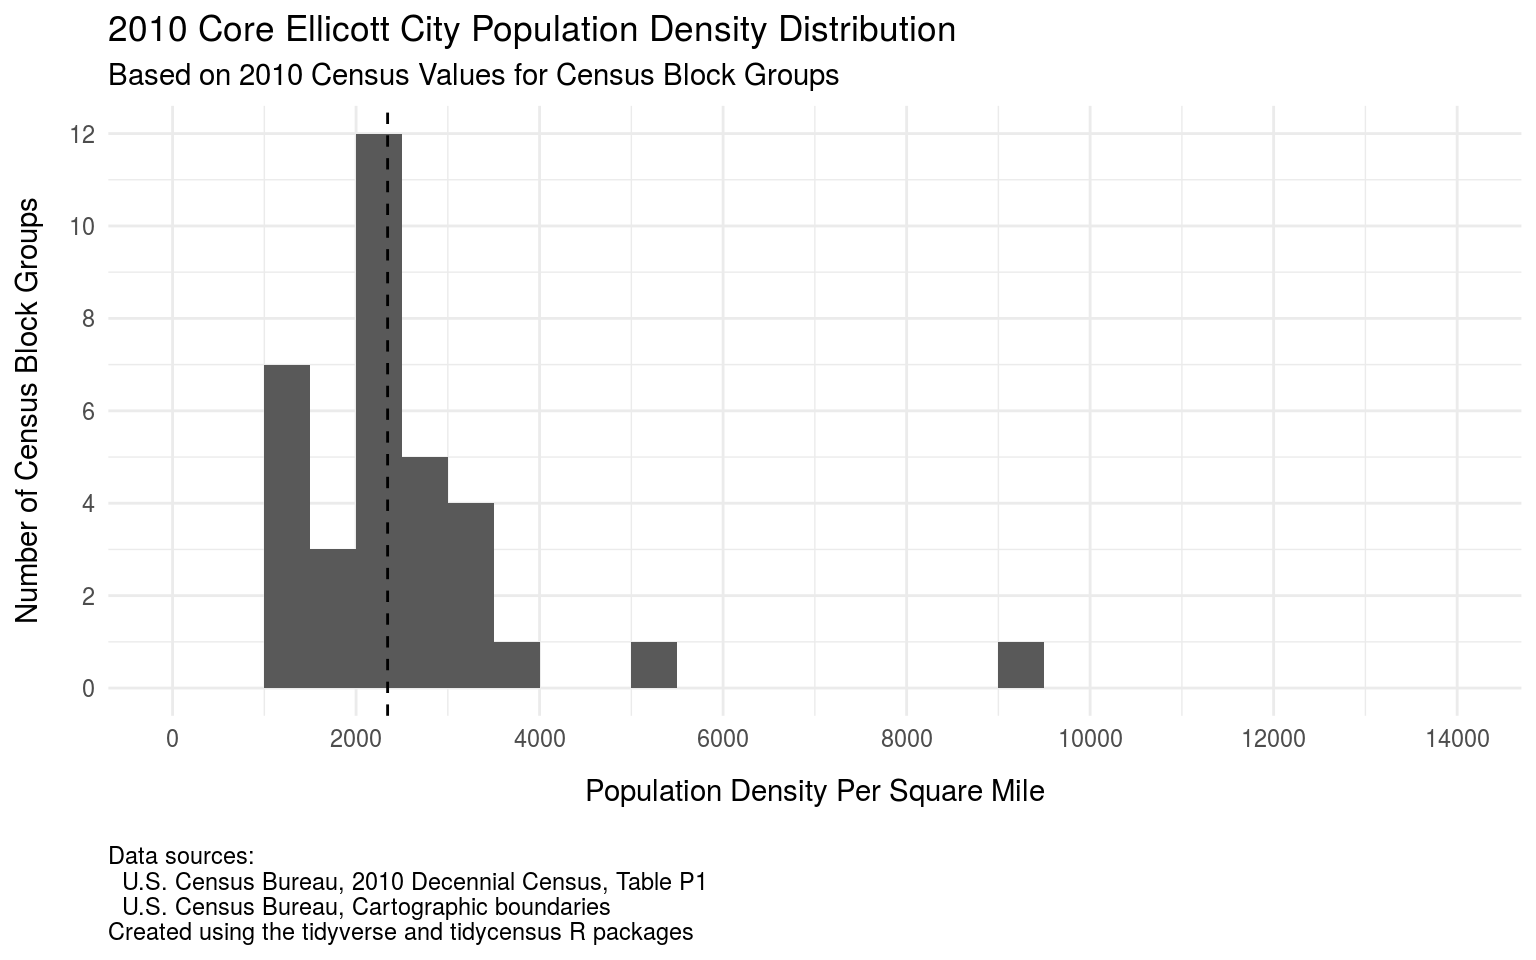
This is confirmed by the histogram above, which shows the distribution of density among the various Ellicott City census block groups in 2010. Most of the CDP was between 1,000 to 4,000 people per square mile, with only two census block groups out of 34 having higher density. The overall population density for Ellicott City in 2010 was 2,234 people per square mile, about a third less than the overall population density for Columbia.
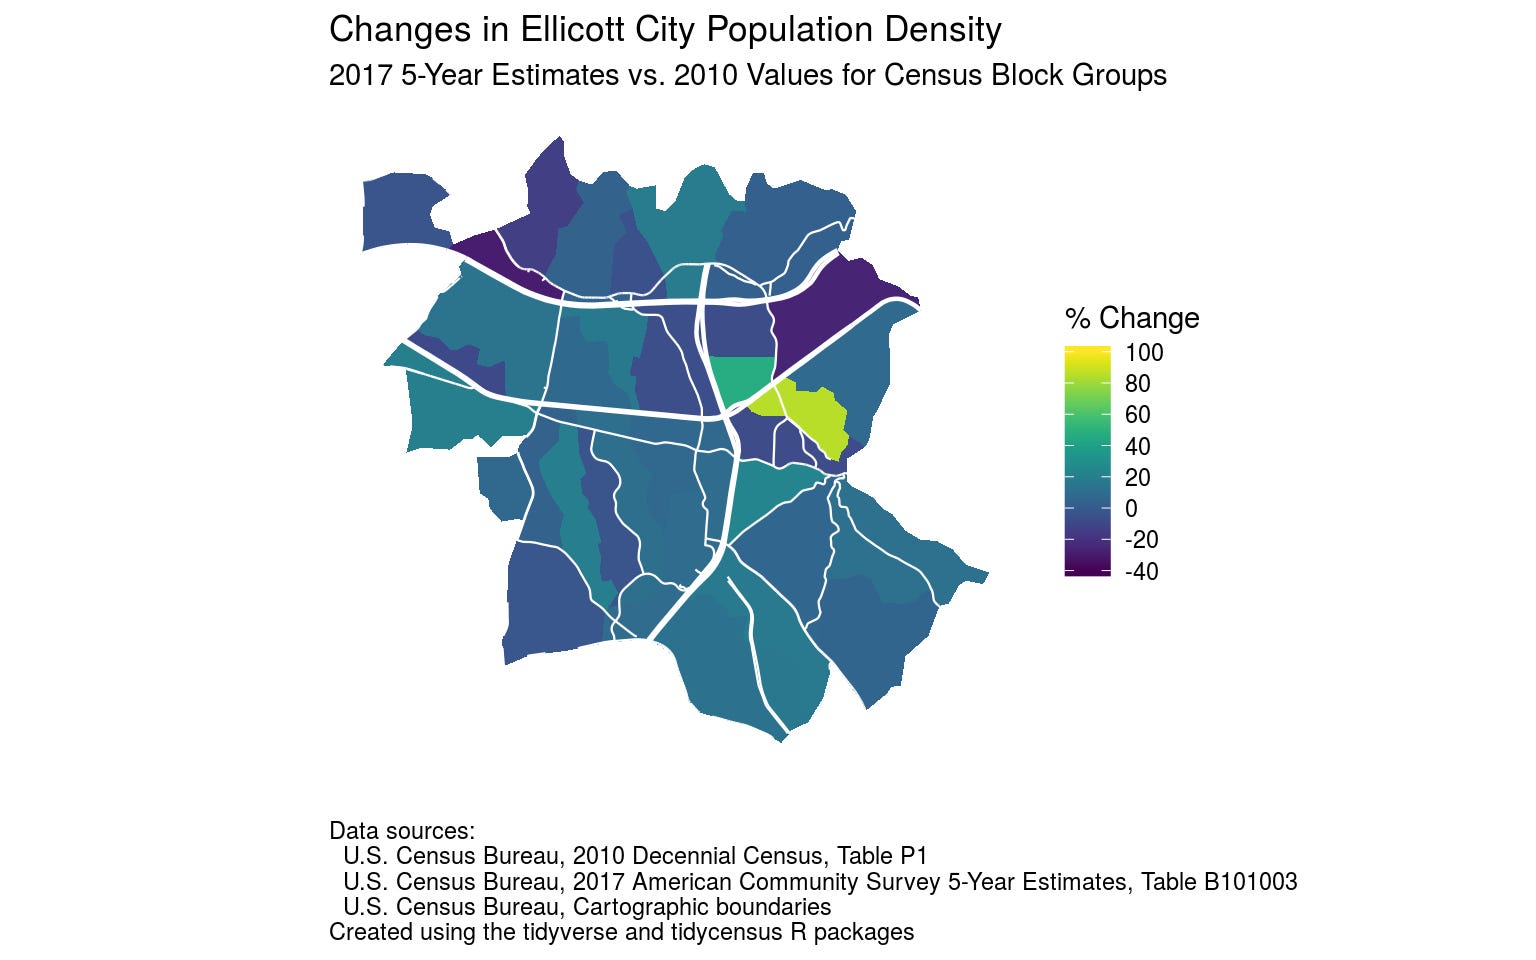
The next map shows changes in population density in Ellicott City between the 2010 census and the 2017 American Community Survey 5-year estimates (which reflect surveys done in 2013 through 2017). Even over this relatively short period we can see a significant decrease in density in the area between US 40 and I-70 west of Rogers Avenue (which includes a good chunk of Patapsco State Park).
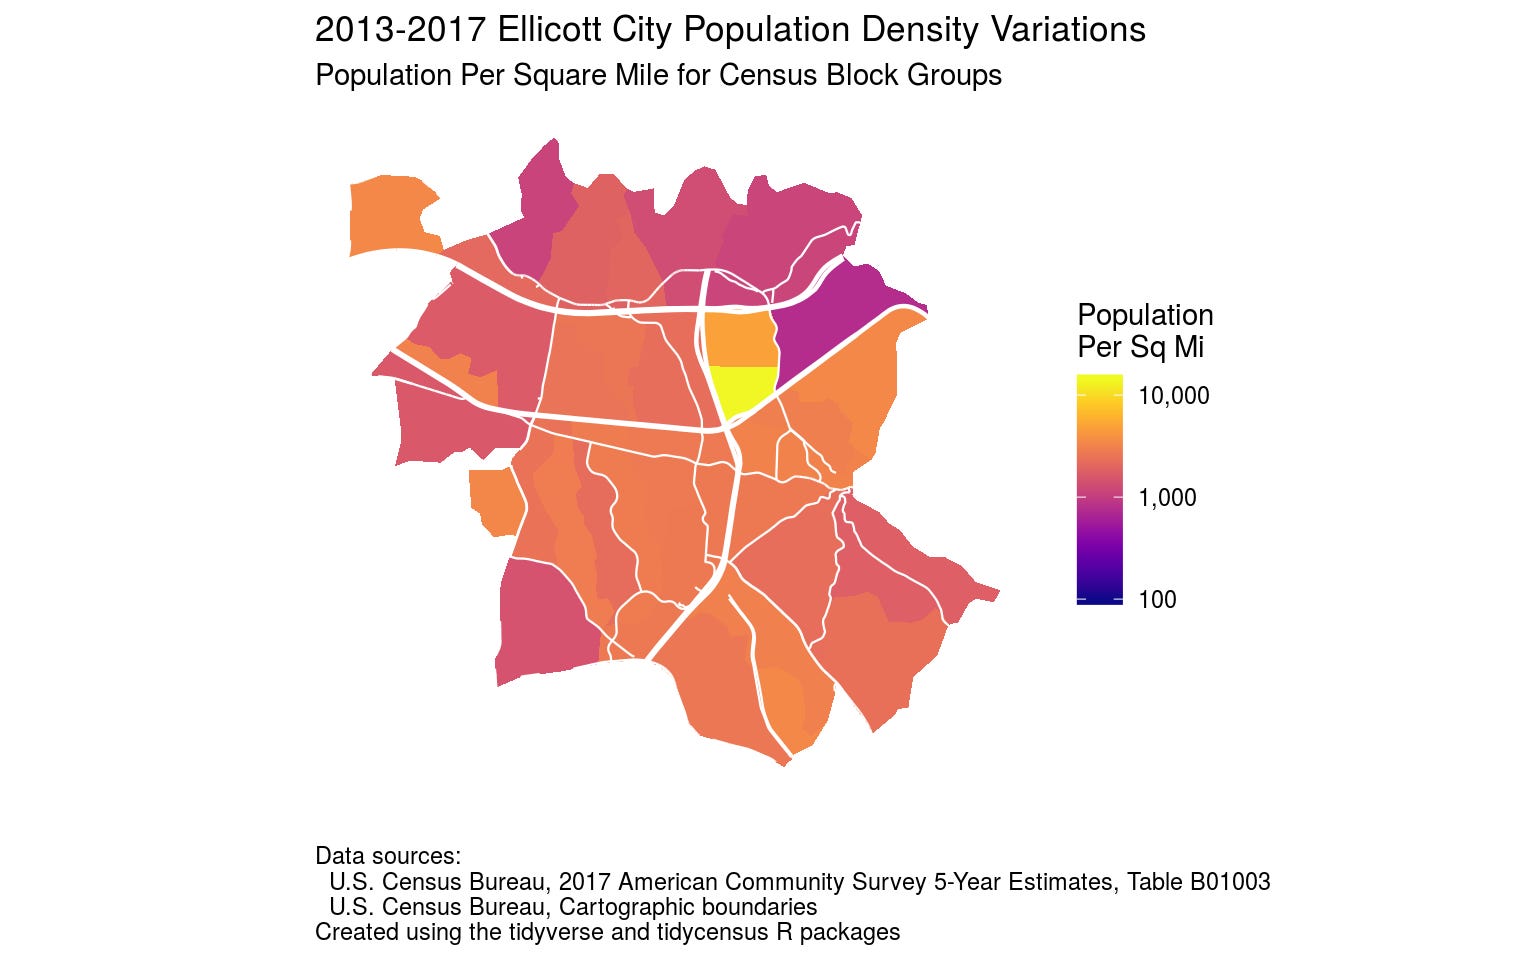
There was also almost a doubling of population density in the area north of old Ellicott City and south of US 40. I don’t know if the latter is due to new development or to changes in household size. However it’s worth noting that based on the 2010 population density map compared to the map for 2013-2017 immediately above, that area was originally less densely populated than most of Ellicott City, and whatever changes occurred brought it up to a “typical” density for the area.
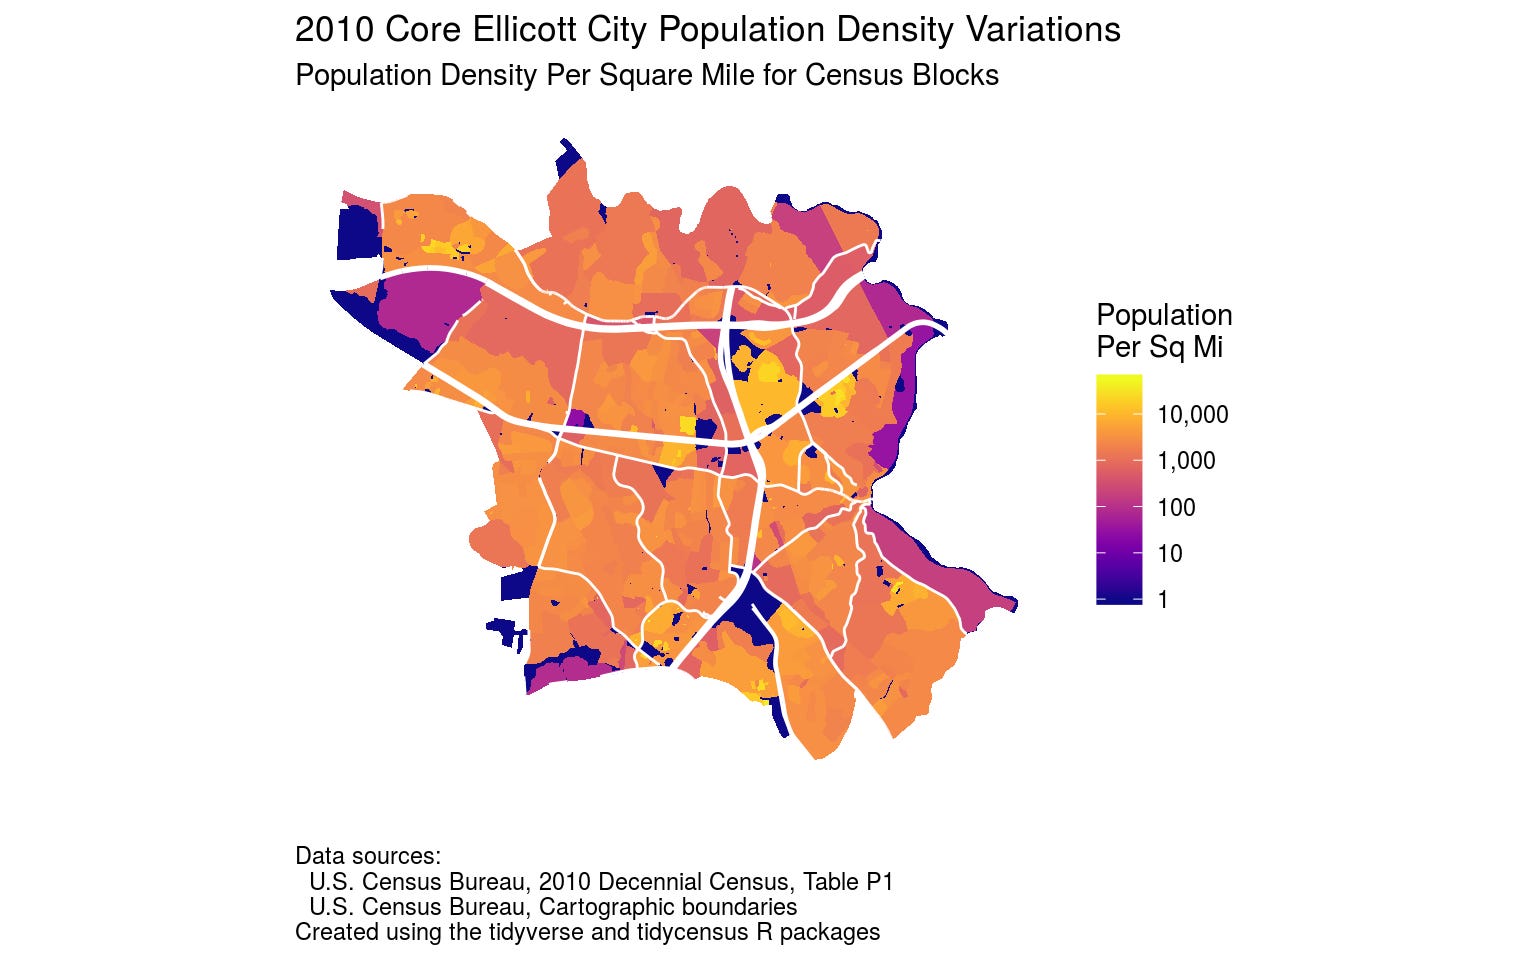
As I did for Columbia, I also mapped density variations at the level of census blocks. This uses population data available for the 2010 census but not for the American Community Survey.
This map is most notable for showing areas of Ellicott City that have very low population densities. These include retail areas like the Long Gate shopping center north of MD 100 and east of US 29, park areas including Patapsco Valley State Park, Meadowbrook Park, and Centennial Park, and golf courses like the one at Turf Valley.
Note that as with Columbia some areas appear on this map that were not on the prior maps. These reflect census blocks that are in the Ellicott City CDP, but that are in census block groups that are mostly not in Ellicott City. The most notable example of this is the Turf Valley resort.
There is also a set of Ellicott City census blocks west of Centennial Lane that appear to be almost disconnected from the rest of the CDP. These appear to be associated with the soccer fields and church at Covenant Park, with Centennial High School and Burleigh Manor Middle School another “low-density” area just north of there. (Recall that “low-density” in this context refers to the size of the residential population in a given area, not how built-up the area is.)
You can find the code and data behind this post, as well as more Ellicott City population statistics, in the document “Ellicott City, Maryland, population density.”
That’s all for this week. A reminder: if you find these posts interesting and useful please tell other people about them and encourage them to subscribe to the Civility and Truth mailing list. Having readers who care enough to subscribe helps motivate me to send these posts out on a regular basis, and the more readers I have the more motivated I’ll be. In the meantime, thanks for reading this post!