tl;dr: Here’s one example of what a more open, fair, and inclusive approach to Howard County Council redistricting could produce.
[This is part 5 of a seven-part series. See also part 1, part 2, part 3, part 4, part 6, and part 7. I also wrote a follow-up post that can be viewed as an alternative to this one.]
In the first post in this series I proposed a comprehensive overhaul of the way we elect the Howard County Council:
- Expand the council from five to fifteen members.
- Reduce the number of council districts from five to three.
- Elect five members in each district using ranked choice voting.
- Draw the district lines using an automated process overseen by an independent nonpartisan commission.
In this post I present the results of the automated redistricting I did using the Auto-Redistrict software to draw district lines for a fifteen-member Howard County Council elected in three districts using ranked choice voting.
What might the new districts look like?
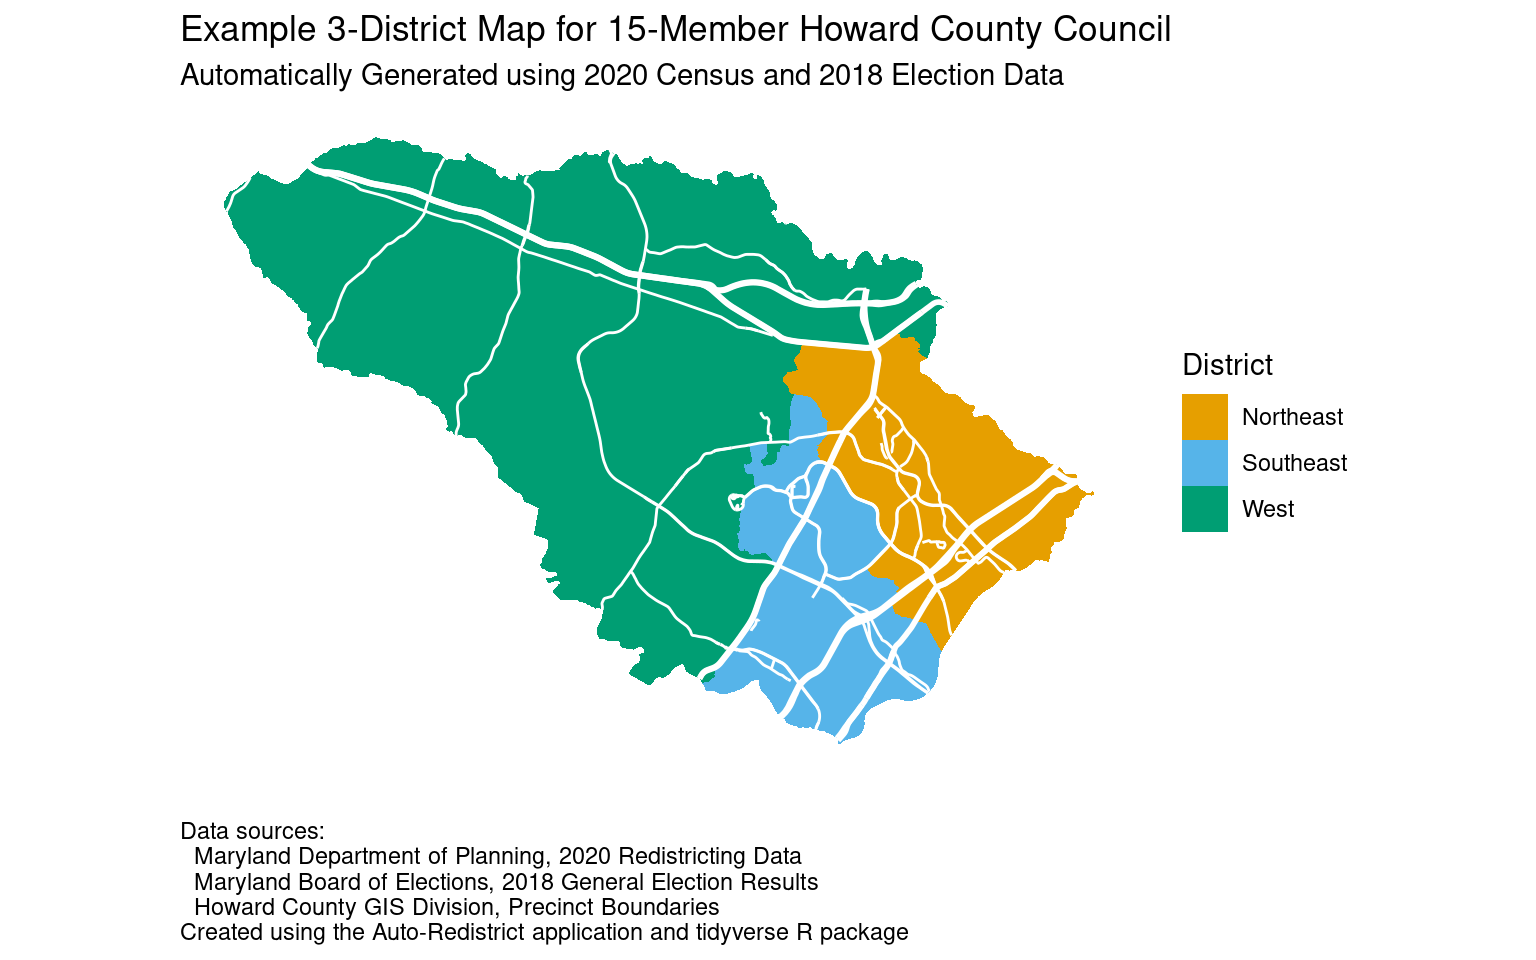
A proposed district map for a fifteen-member Howard County Council elected in three districts (five members per district) using ranked choice voting. (Click for a higher-resolution version.) Image by Frank Hecker; made available under the terms of the Creative Commons CC0 1.0 Universal (CC0 1.0) Public Domain Dedication.
The map above shows the three districts produced by the Auto-Redistrict software based on the data and options I provided. The new districts divide the county into the following areas:
- Southeastern Howard County, including Savage, North Laurel, most of east Columbia south of Route 175, and most of west Columbia except the Village of River Hill.
- Northeastern Howard County, including Elkridge, Ellicott City south of Route 40, and east Columbia north of Route 175.
- Western Howard County, including Ellicott City north of Route 40, Maple Lawn, and the Village of River Hill in Columbia.
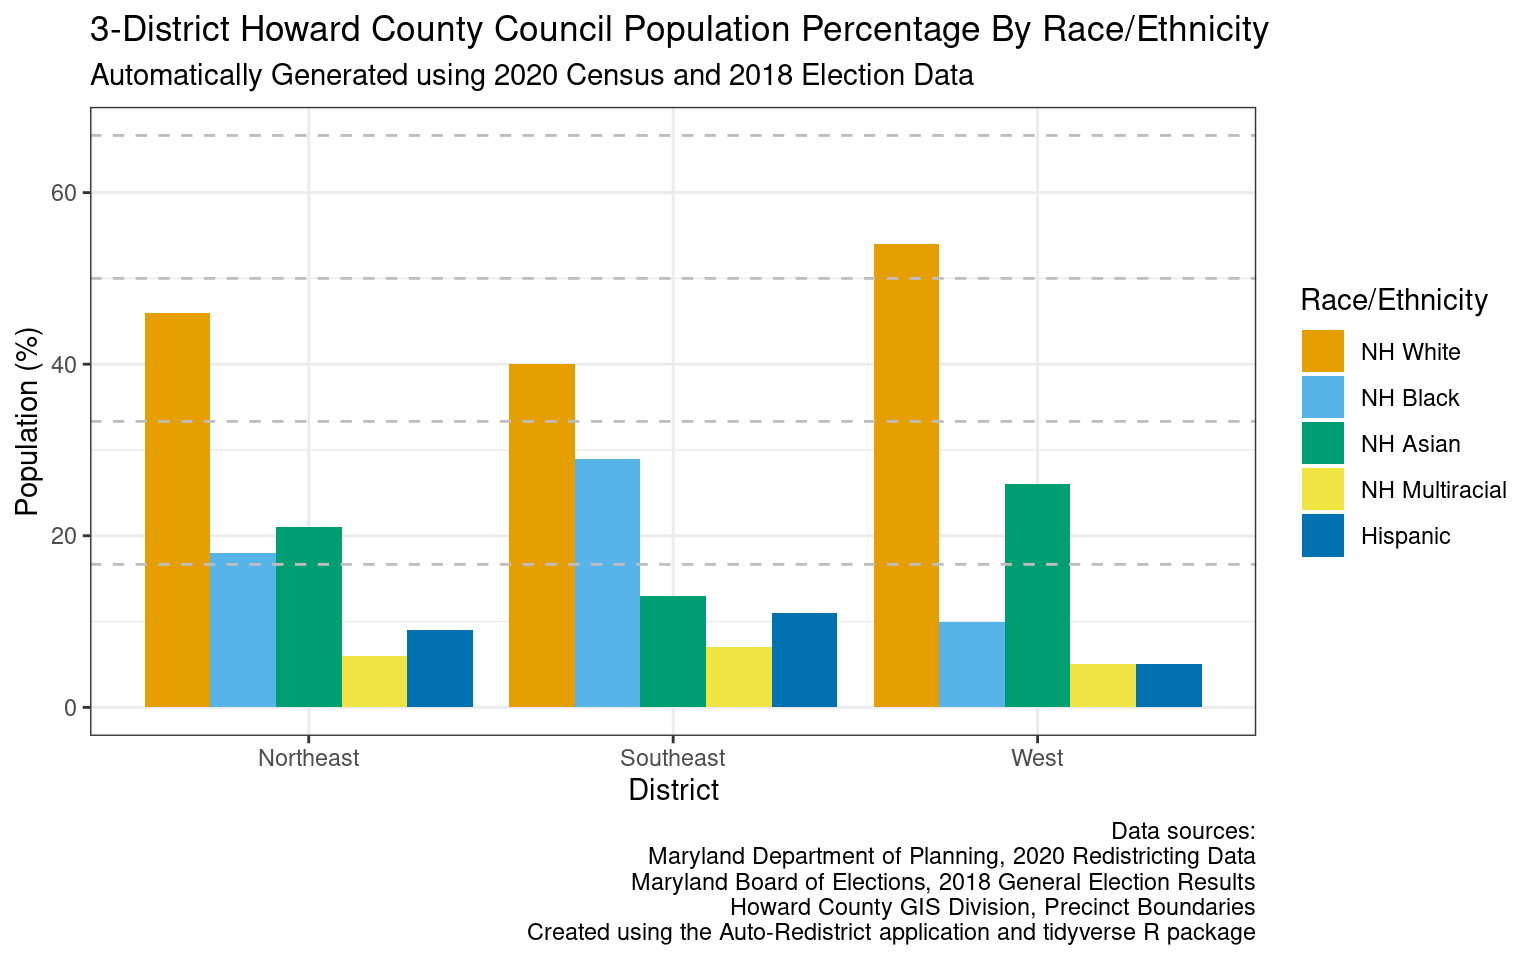
The graph above shows the population percentage breakdown by race and ethnicity for each of the three proposed Howard County Council districts. (Click for a higher-resolution version.) Image by Frank Hecker; made available under the terms of the Creative Commons CC0 1.0 Universal (CC0 1.0) Public Domain Dedication.
Based on the 2020 Census figures, the racial and ethnic groups in these three districts would break down as follows:
- Northeast District. Non-Hispanic Whites would be a minority in this district, at 46%. Non-Hispanic Blacks and Asians would form roughly equal parts of the population at 18% and 21% respectively. People of Hispanic origin would be about half those percentages at 9%, and multi-racial people or people of other races would be the smallest group, at 6%.
- Southeast District. The population of non-Hispanic Whites in this district would be even lower, at 40%, with Blacks at about three-quarters of the White population, at 29%. The population of Asians and people of Hispanic origin would be roughly comparable at 13% and 11 % respectively, with multiracial people or people of other races again the smallest group, at 7%.
- West District. This is the only district in which non-Hispanic Whites would form a majority, at 54%. At 26% Asians would have almost as significant a presence in this district as Blacks would in the Southeast District. The population of Blacks would be the smallest of any of the three districts, at 10%. Finally, the populations of people of Hispanic origin and of multiracial people or people of other races would be relatively small, at 5% each.
For Howard County as a whole the breakdown of groups is as follows: 8% persons of Hispanic origin, with the remaining (non-Hispanic) population 47% White, 20% Asian, 19% Black, and 5% multiracial, with the number of American Indians, native Hawaiians, and people of other races negligible.
(The breakdown for those 18 years of age or older is similar but leans slightly whiter: 7% Hispanic origin, 51% White, 19% Asian, 18% Black, 3% multiracial, and the remaining groups negligible. I used total population figures with Auto-Redistrict because many of those under the age of 18 will become voters over the next ten years.)
The task of estimating the number of council members from the various racial or ethnic groups is complicated by several factors. One is that the “Asian” category encompasses both East Asians (e.g., Korean- or Chinese-Americans) and South Asians (e.g., Indian-Americans or Pakistani-Americans), and it can’t be assumed that they would vote in similar ways. Another is that it’s not clear who exactly comprises the group of multi-racial voters, and how they might vote.
Having said that, my guess is that under the proposed council district scheme that Blacks and Asians would be represented on the county council in rough proportion to their presence in the population. For example, there would likely be one Black council member from the Northeast District, and at least one and possibly two Black council members from the Southeast District. There would also likely be an Asian council member from the West District, and possibly one each from the Northeast and Southeast Districts.
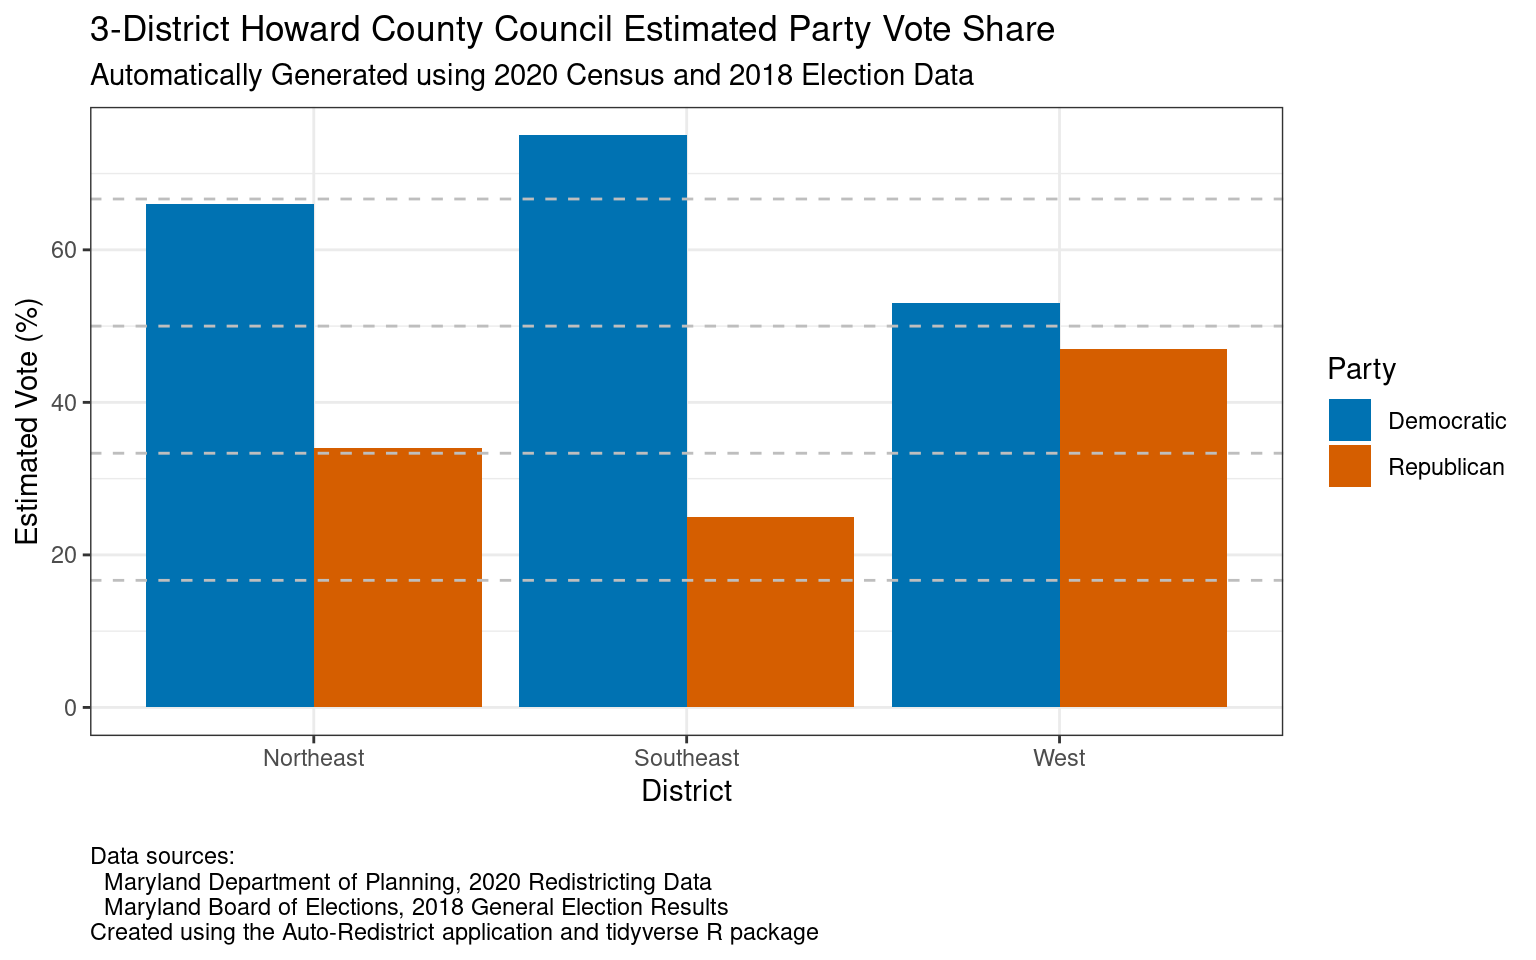
The graph above shows the estimated major party vote share for each of the proposed three Howard County Council districts, based on estimated votes by precinct in the 2018 general elections for Howard County Council. (Click for a higher-resolution version.) Image by Frank Hecker; made available under the terms of the Creative Commons CC0 1.0 Universal (CC0 1.0) Public Domain Dedication.
How would Democratic and Republican candidates fare in each district, and what might the final makeup of the Howard County Council look like? When ranked choice voting is used in a five-member district, a candidate is automatically elected if they are selected as the first preference on just over one-sixth of the ballots cast, or about 16.7% of those voting. (This number is known as the threshold or quota.)
So, for example, in the precincts comprising the Northeast District I estimated the Republican share of the total vote for Howard County Council in the 2018 general election at about 34%. If a single Republican candidate ran in the Northeast District they would pretty much be guaranteed to be designated as the most preferred candidate by at least 16.7% of voters. The Republican Party would thus have one “safe” seat in the Northeast District.
On the other hand, for the precincts in the Northeast District I estimated the Democratic share of the county council vote in 2018 at about 66%. Suppose that only three Democratic candidates ran in the Northeast District and they each received roughly equal shares of the first preference votes—in other words, about a third of Democratic voters picked the first candidate as their most preferred candidate, about a third of Democrats gave their first preference to the second candidate, and about a third of Democrats gave their first preference to the third candidate.1
Then given a 66% Democratic vote share each candidate would be designated as the most preferred candidate by about 22% of voters, well over the quota of 16.7%, and all would automatically be elected. The Democratic Party would thus have three “safe” seats in the Northeast District.
What about the remaining seat? Suppose that the Republican Party ran two candidates, the Democratic Party ran four, and each candidate received first preference votes from a roughly equal share of their own party’s voters. Then each Republican candidate would receive about 17% of first preference votes (34% divided by two), and each Democratic candidate would receive about 16.5% of the first preference votes (66% divided by four).
Since all six candidates would be close to the threshold value of 16.7%, and they could not all be elected, it would be a toss-up as to whether the Democrats or Republicans would win the fifth and final seat after accounting for all the second, third, etc., preferences expressed by voters.2
A similar analysis can be done for the other two districts. A summary of the likely results is as follows:
- Northeast District: Party breakdown: 66% Democrats, 34% Republicans. Likely three safe Democratic seats, one safe Republican seat, and one toss-up.
- Southeast District: Party breakdown: 75% Democrats, 25% Republicans. Likely three safe Democratic seats, one safe Republican seat, and one leaning Democratic.
- West District: Party breakdown: 53% Democrats, 47% Republicans. Likely two safe Democratic seats, two safe Republican seats, and one leaning Democratic—albeit only slightly.
Overall with this district map and the use of ranked choice voting Democrats would likely win at least eight seats on the Howard County Council and Republicans at least four. The remaining three seats would be in play, with the most likely result being a 9–6 or 10–5 Democratic majority—a significantly more balanced result than the 4–1 Democratic majority on the current council. (And as noted previously it’s also possible that a third party or independent candidate could capture a seat and act as a deciding vote on the council.)
In my next post I attempt to answer various questions that have been raised regarding this particular proposal and regarding ranked choice voting in general.
For further exploration
For the code used to generate the graphs above, see my document Howard County Council Expansion, Part 3. For the data behind the district maps see Howard County Council Expansion, Part 1.
This equal division of first preference votes is not guaranteed to happen, especially if one of the candidates is much more popular than the other two. However parties can do various things to influence their voters and make an equal division more likely, a process known as “vote management.” For example, one technique is to randomize the 1–2–3– . . . order of candidates on the sample ballots that parties mail to prospective voters. ↩︎
There is an inherent trade-off here between risk and reward. For example, if the Democratic party ran only three candidates in this district then they would almost be guaranteed three seats based on first-preference votes. If instead they ran four candidates then they would risk having none of them be elected in the first round, and then having to depend on transfers in subsequent rounds. If Republicans ran only two candidates and an independent or third-party candidate attracted significant first- and second-preference votes then it’s possible that Democrats might win only two seats. ↩︎