tl;dr: Another approach to expanding the Howard County Council, still using five districts but now with three members per district.
This is a follow-up to my seven-part series (starting with part 1) on expanding the Howard County Council, using ranked choice voting to elect council members, and leveraging automated redistricting software overseen by an independent redistricting commission.
This particular post describes an alternative to the three-district map proposed in that series and illustrated in part 5: I retain the idea of a fifteen-member county council, but instead of using three districts (with five members each) I use five districts (as with the current council), electing three members in each district. As in the previous example I assume the use of ranked choice voting.
An example five district map

A proposed district map for a fifteen-member Howard County Council elected in five districts (three members per district) using ranked choice voting. (Click for a higher-resolution version.) Image by Frank Hecker; made available under the terms of the Creative Commons CC0 1.0 Universal (CC0 1.0) Public Domain Dedication.
The map above shows the five districts produced by the Auto-Redistrict software based on the data and options I provided. The new districts divide the county into the following areas; I’ve numbered the districts so that they roughly correspond with the current council districts:
- District 1. Ellicott City.
- District 2. Northeastern Howard County, including Elkridge.
- District 3. Southeastern Howard County, including North Laurel, Savage, Maple Lawn, and Fulton, as well as the Village of Kings Contrivance.
- District 4. Central Columbia, excluding some outlying villages.
- District 5. Western Howard County, including the Villages of River Hill and Harper’s Choice.
Because of the way that the Auto-Redistrict software works, starting from a random assignment of precincts to districts and then “evolving” the map from there, each run may end up producing a somewhat different map. For this run I was lucky, as I think this particular map does a really good job of matching up with the key population centers in the county. The main departure is that Columbia is too populous to fit into a single district; the proposed District 4 includes only about two-thirds of Columbia’s population.
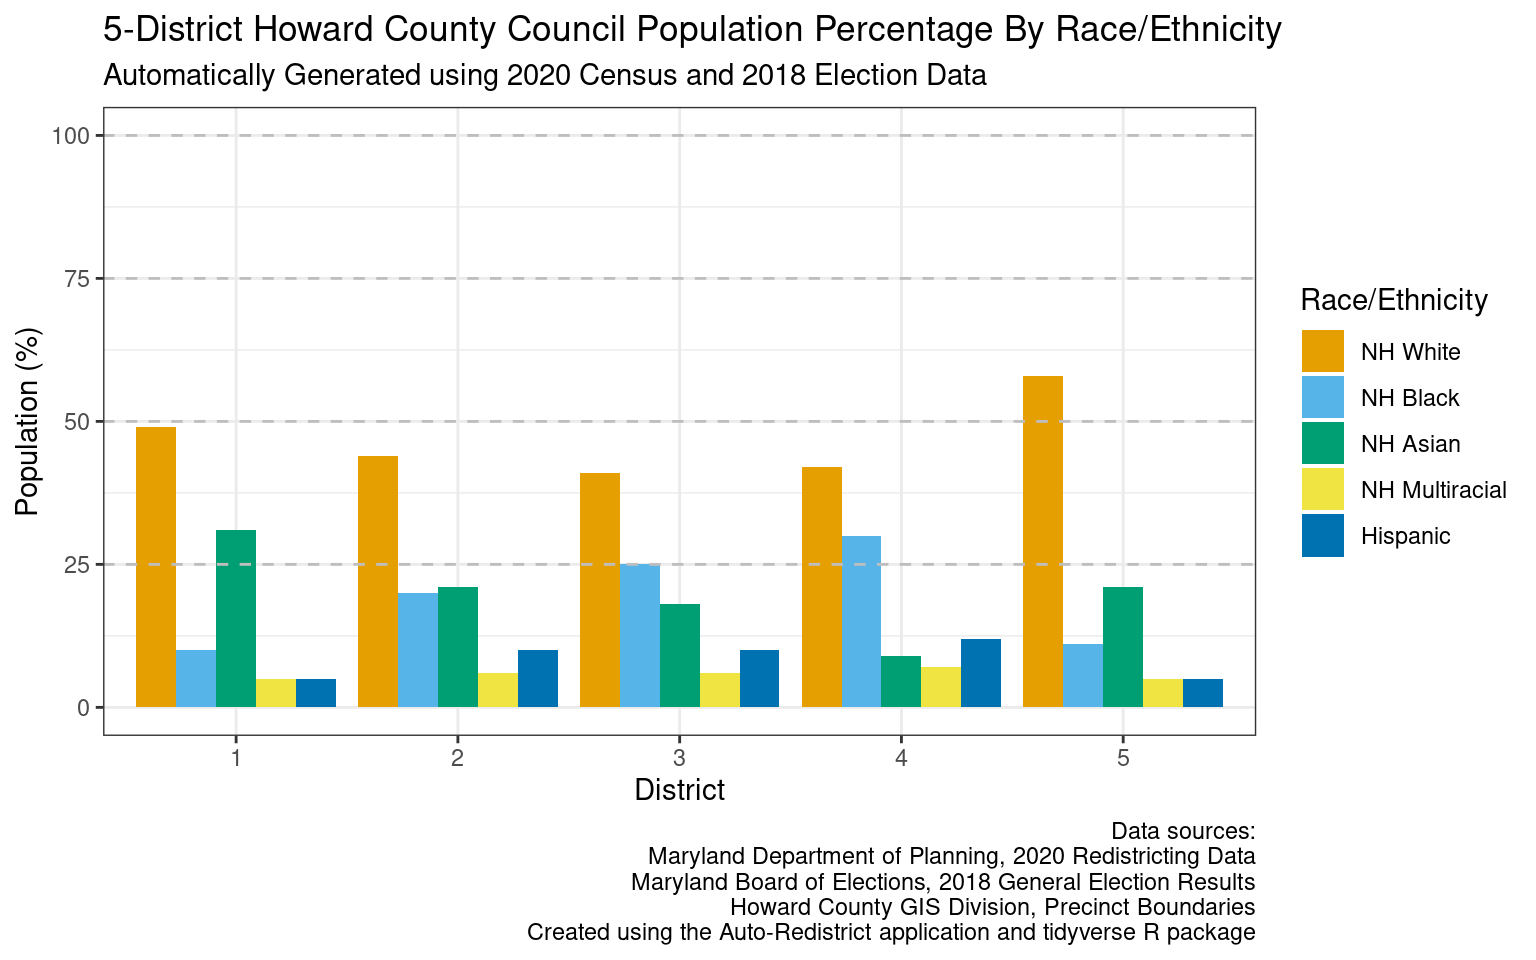
The graph above shows the population percentage breakdown by race and ethnicity for each of the five proposed Howard County Council districts. (Click for a higher-resolution version.) Image by Frank Hecker; made available under the terms of the Creative Commons CC0 1.0 Universal (CC0 1.0) Public Domain Dedication.
Based on the 2020 Census figures, the racial and ethnic groups in these five districts would break down as follows:
- District 1. Non-Hispanic Whites would comprise about half the population of this of this district, at 49%, with Asians the next largest group at about 31%. Non-Hispanic Blacks would comprise about 10% of the population at 10%, with multi-racial people (or people of other races) and people of Hispanic origin the smallest groups, at about 5% each.
- District 2. Non-Hispanic Whites would be a slight minority in this district, at about 46%. Blacks and Asians would be roughly equal as a proportion of the population, at about 20% and 21% respectively. People of Hispanic origin would be about 10%, and multi-racial people or people of other races about 6%.
- District 3. Non-Hispanic Whites would be a distinct minority in this district, at 41% of the population, with Blacks and Asians about 25% and 18% respectively. The proportions of people of Hispanic origin and multi-racial people (or people of other races) would be comparable those in District 2, at 10% and 6% respectively.
- District 4. Non-Hispanic Whites would again be a distinct minority in this district, at 42%. This district would have the highest Black population, at 30%. The next most populous group would be people of Hispanic orgin at 12%, with Asians at 9% and multi-racial people and people of other races at 7%.
- District 5. This would be the only district with a non-Hispanic White majority, at 58%. The proportion of Asians would be about 21% (similar to District 2), while the proportion of Non-Hispanic Blacks would be about 11% (similar to District 1). The proportions of people of Hispance origin and multi-racial people (or people of other races) would be similar to those in District 1, at %% each.
(For figures for Howard County as a whole, see part 5 of the redistricting series.)
Assuming some level of vote transfers, Blacks would be well-positioned to win seats in Districts 4, 3, and 2 (in that order), while Asians would be positioned to win seats in Districts 1, 2, and 5. (Again, see part 5 for a caution about interpreting “Asians” as a monolithic demographic group.)
The remaining nine seats would likely go to Non-Hispanic Whites. As of the 2020 Census Non-Hispanic Whites are now a minority in the county overall, but they’d likely still comprise a majority on the county council—though not as much so as at present.
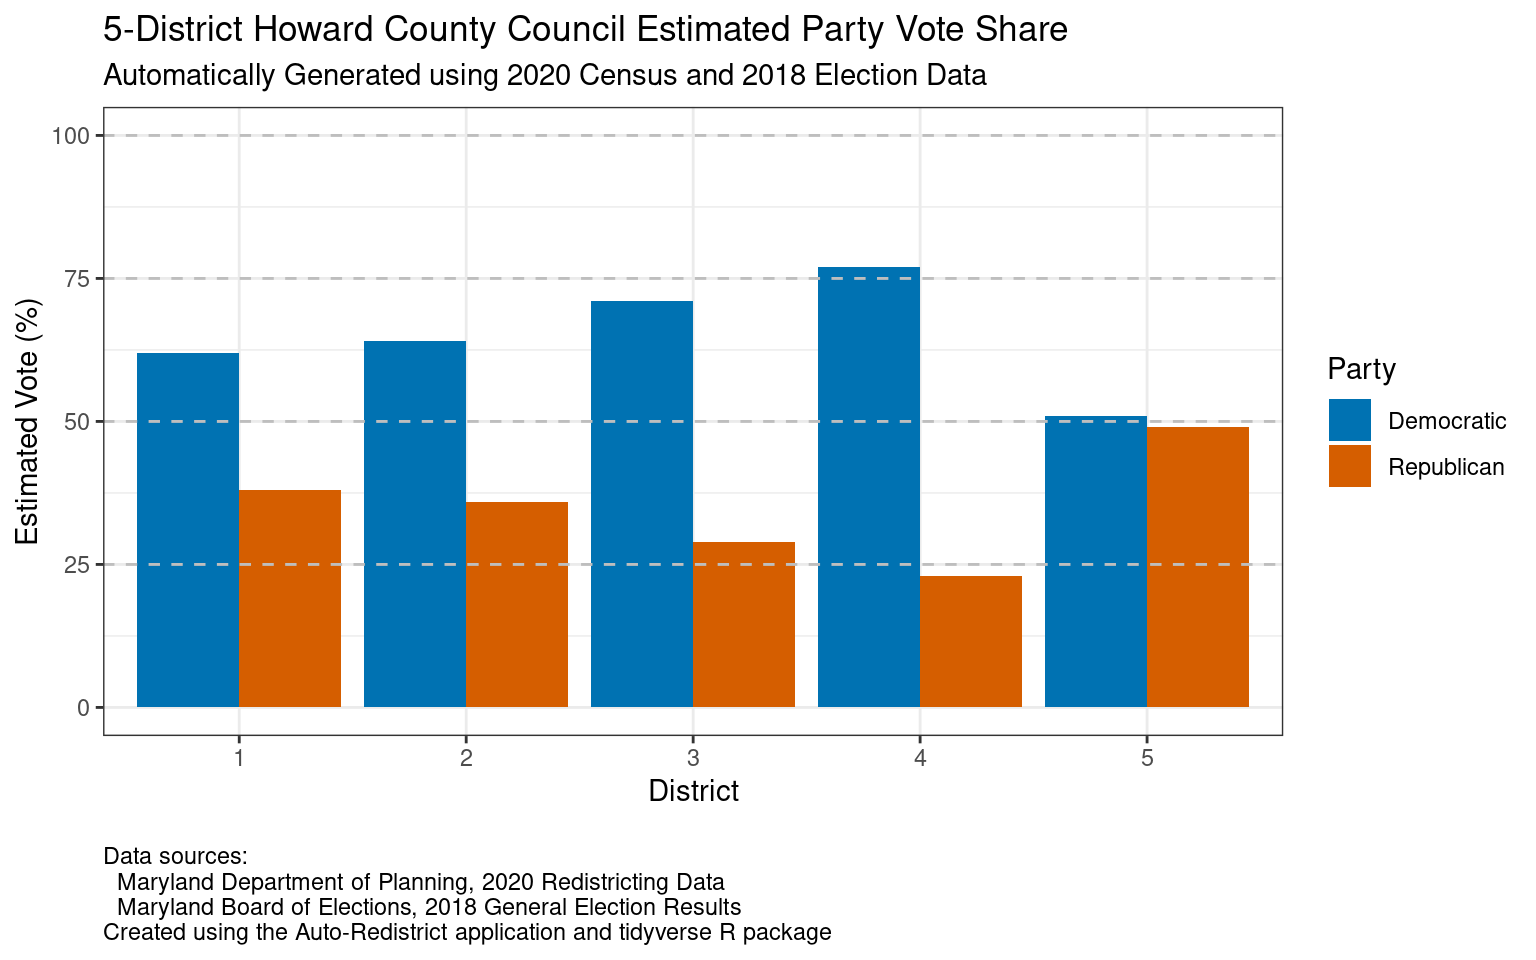
The graph above shows the estimated major party vote share for each of the proposed five Howard County Council districts, based on estimated votes by precinct in the 2018 general elections for Howard County Council. (Click for a higher-resolution version.) Image by Frank Hecker; made available under the terms of the Creative Commons CC0 1.0 Universal (CC0 1.0) Public Domain Dedication.
How would Democratic and Republican candidates fare in each district, and what might the final makeup of the Howard County Council look like? When ranked choice voting is used in a three-member district, a candidate is automatically elected if they are selected as the first preference on at least 25% plus one of the ballots cast (the “quota”).
So, for example, in the precincts comprising the proposed new District 1 I estimated the Republican share of the total vote for Howard County Council in the 2018 general election at about 38%. If a single Republican candidate ran in the Northeast District they would pretty much be guaranteed to be designated as the most preferred candidate by more than 25% of voters. The Republican Party would thus have one “safe” seat in the proposed District 1.
On the other hand, for the precincts in the proposed new District 1 I estimated the Democratic share of the county council vote in 2018 at about 62%. Suppose that only two Democratic candidates ran in the Northeast District and they each received roughly equal shares of the first preference votes—in other words, about half of Democratic voters picked the first candidate as their most preferred candidate and about half of Democrats gave their first preference to the second candidate.
Then given a 62% Democratic vote share each candidate would be designated as the most preferred candidate by about 31% of voters, well over the quota of 25% plus one, and both would automatically be elected. The Democratic Party would thus have two “safe” seats in the Northeast District.
With one Republican seat and two Democratic seats that would fill all three seats in the district. The Democratic party might be tempted to run three candidates, or the Republican party two, but they’d be running a risk in doing so. (See part 6 for a more in-depth discussion of this issue.)
A similar analysis can be done for the other districts. A summary of the likely results for all districts is as follows:
- District 1. Party breakdown: 62% Democrats, 38% Republicans. Likely two safe Democratic seats, one safe Republican seat.
- District 2. Party breakdown: 64% Democrats, 36% Republicans (similar to District 1). Likely two safe Democratic seats, one safe Republican seat.
- District 3. Party breakdown: 71% Democrats, 29% Republicans. Likely two safe Democratic seats and one safe Republican seat, although it’s possible that Democrats might be able to win all three seats against a weak Republican candidate.
- District 4. Party breakdown: 77% Democrats, 23% Republicans. Democrats would have an even better chance here for a three-seat sweep.
- District 5. Party breakdown: 51% Democrats, 49% Republicans. This would likely be a true swing district, with one safe Democratic seat, one safe Republican seat, and one seat a toss-up.
Overall with this district map and the use of ranked choice voting Democrats would likely win at least nine or ten seats on the Howard County Council and Republicans at least four. The remaining one or two seats would be in play, with the most likely result being a 10-5 or 11-4 Democratic majority—a more balanced result than the 4-1 Democratic majority on the current council. (And as noted in a previous post it’s also possible that a third party or independent candidate could capture a seat and act as a deciding vote on the council.)
Overall the idea of electing fifteen council members from five districts has a lot to recommend it: the use of five districts is a continuation of current practice, and the resulting map is very reflective of the geography of the county.
Electing only three members per district using ranked choice voting (as opposed to five) would also simplify both ballot design and the task of voters: there would likely be fewer candidates on the ballot to rank, and in some cases Republican voters at least would likely only need to indicate a first preference (assuming that they were indifferent as to which Democratic candidates were elected).
The major downside of this approach, at least from the point of view of the Republican party, is that it somewhat disadvantages Republican candidates relative to electing five members in each of three districts. That’s a general issue with ranked choice voting: for a minority party’s results to match its vote share, it helps to have more candidates on the ballot for voters to rank.
For further exploration
For the code used to generate the graphs above, see my document Howard County Council Expansion, Part 4. For the data behind the district maps see Howard County Council Expansion, Part 1. I ran the Auto-Redistrict application as described in part 4 of my redistricting series, using the same input data and the same settings, except that I specified five districts with three members each instead of three districts with five members each.