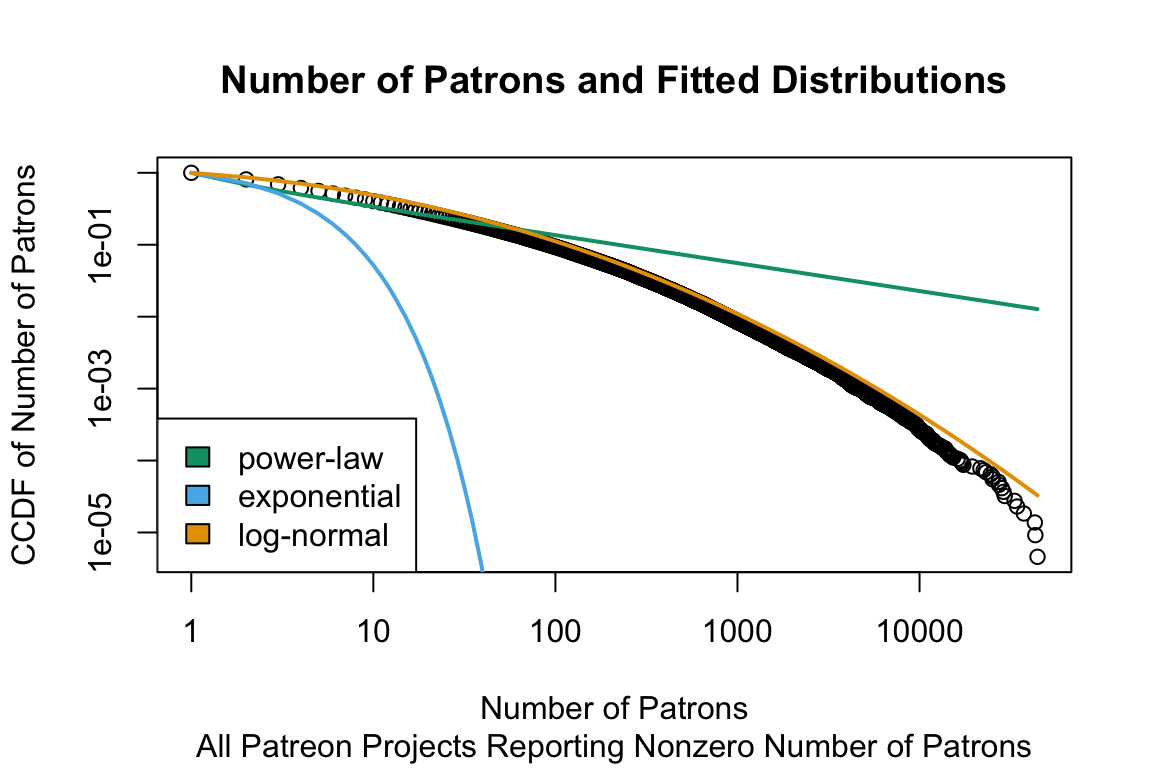
Plot showing attempts to fit a model for the number of patrons per Patreon project for a power-law distribution, exponential distribution, and log-normal distribution. Click for a higher-resolution version. Image by Frank Hecker; made available under the terms of the Creative Commons CC0 1.0 Universal (CC0 1.0) Public Domain Dedication.
[This post was originally published on Cohost.]
(My apologies, I couldn’t think of a clever headline for this.) In a comment on my “Life in Patreonia” post, @tekgo asked whether the number of patrons of Patreon projects was distributed in a similar way to the earnings for Patreon projects.
The short answer is “yes, it is.” The long answer is here. The in-between answer is that in the sample of about 218,000 projects, the number of patrons per project appears to have a log-normal distribution (like earnings), with a median number of 6 patrons per project. The chances of having more than 10 patrons is about 40%, the chances of having more than 100 is less than 10%, and the chances of having more than 1,000 is less than 1%.