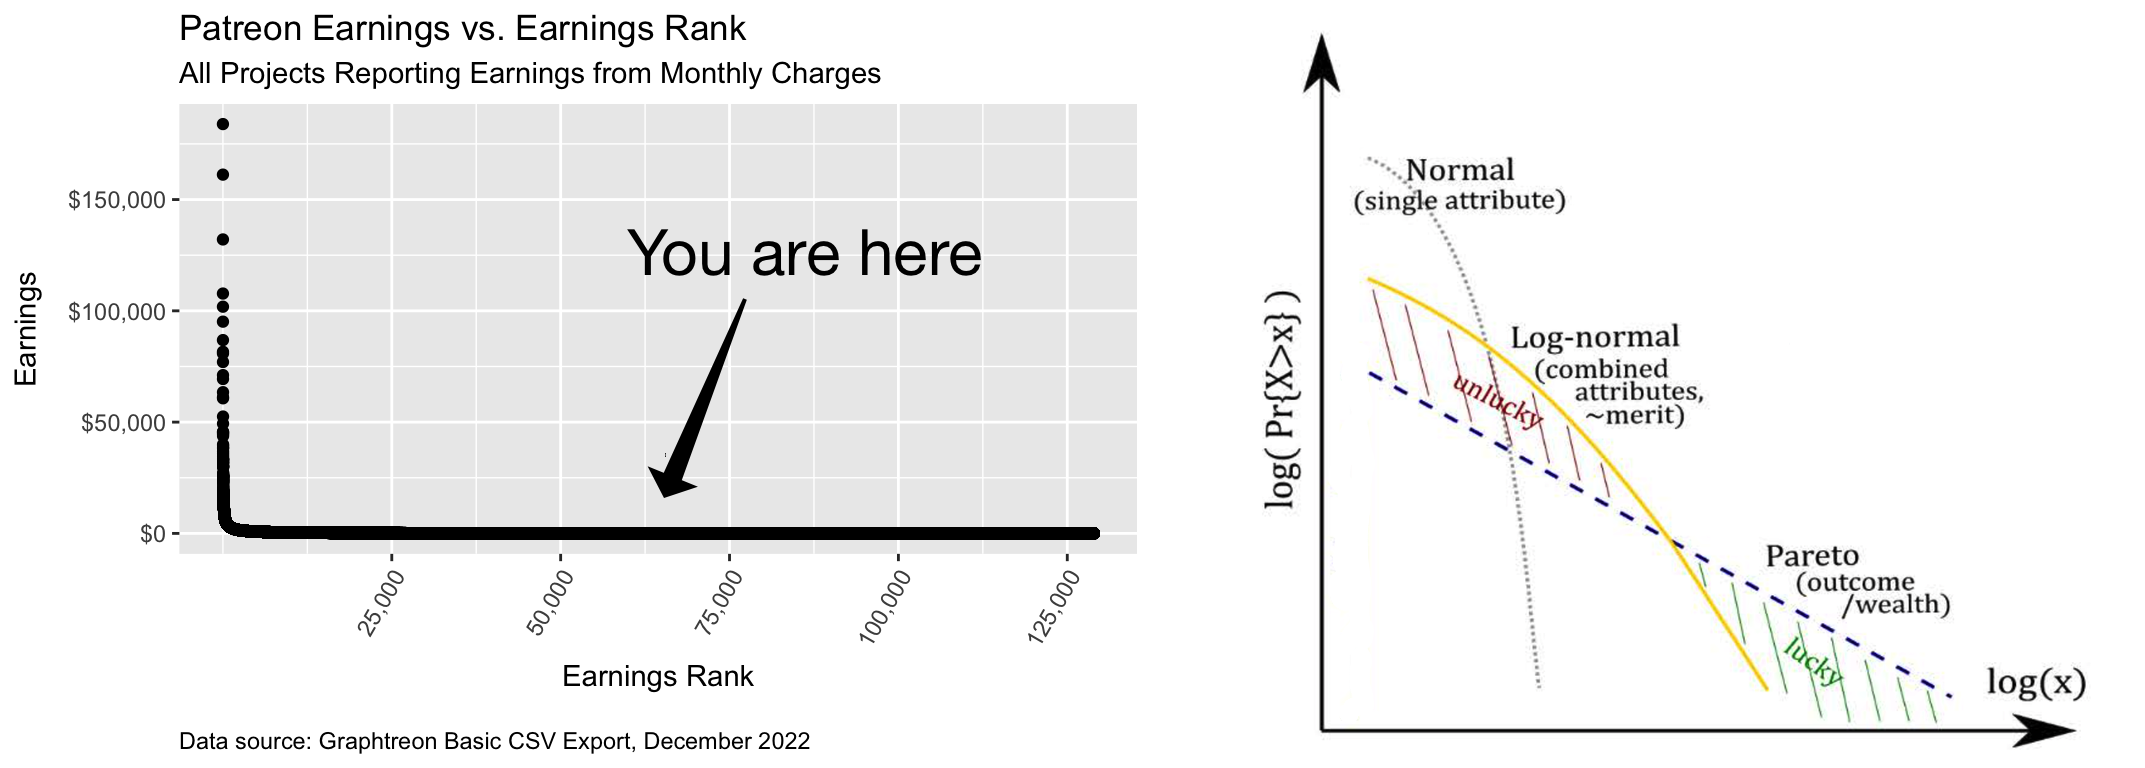
Left: Distribution of Patreon earnings vs. earnings rank; high earners are to the left. Adapted from Hecker, “Distribution of Earnings Among Patreon Projects Charging by the Month.” Right: The probability of earning more than a certain amount; high earners are to the right. Adapted from Sornette, et al., “The fair reward problem: the illusion of success and how to solve it.”
[This post and its associated comments were originally published on Cohost.]
Note to stats nerds: I too have read Clauset, et al., and am well aware that many things claimed to follow a power law actually do not. (For example, this appears to be true for Patreon earnings.) But “I fought the log-normal distribution and the log-normal distribution won” doesn’t have quite the same ring to it.
If you happen to listen to “Discover Weekly” on Spotify (as I do), or regularly check out musicians on Bandcamp (as I also do) then from time to time you may have thought to yourself, “Wow, this is really good! Why haven’t I ever heard of them?” Apparently there are more musicians with real talent than there are popular and successful musicians, and sometimes the most talented are not necessarily the most successful.
This experience is not confined to music, but applies to other areas as well. For example, I suspect that hidden in the lower half of Patreon projects by number of patrons there are writers and artists whose work is as worthy as that of those who occupy the top 100 places.
Why should this be? That’s the key question for today’s post. It’s a very political question, in that proposed answers are often used to justify existing distributions of fame and wealth, or alternately to deny those justifications. I’m still exploring this general topic, so you can consider this just one take on the subject, with others possibly to follow in future posts. (WARNING: This will be a bit long.)
The proposed answer I’m going to present in this post is adapted from Sornette, et al., “The fair reward problem: the illusion of success and how to solve it.” The general idea is that when we look at things like the number of views on YouTube, the number of listens on Spotify, or the distribution of Patreon earnings, we’re seeing the effects of 1) individual talents influenced by lots of little things that add up (and hence result in a normal distribution), which then 2) combine through multiplication to produce a log-normal distribution of overall skill at artistic (or other) endeavors, and are then 3) supplemented by luck to produce a power law distribution (at least at the high end, and possibly at the low end as well).
It all adds up
Let’s start with a specific talent, for example, having a good singing voice. I’m no anatomist or vocal coach, but I can think of lots of little things that might influence this: size, structure, and health of the vocal cords, size and structure of the mouth, throat, nasal passages, and sinuses; size, shape, and motility of the tongue, lung capacity and diaphragm strength; the ability to control one’s voice (e.g., to accurately hit certain pitches); and so on.1
Some of these things might be determined at conception (genetic heritage), some in utero (by random acts of development), and some after birth (e.g., being able to get a music education and afford voice lessons). The relative importance of these can be and is debated, but my point here is simply that most of these influences act relatively independently of each other, and together they add up to determine the overall quality of a person’s singing voice.
If multiple independent things do add up together to determine vocal quality, the result when we look at voice quality across the population as a whole should be a so-called Gaussian or “normal”2 distribution, with a hump in the middle representing people with average singing voices, a tail at the left representing people with below-average singing voices, and a similar tail at the right representing people with above-average singing voices.
Why should this be? Think of having a really excellent singing voice as being the equivalent of flipping a coin and having it come up heads (say) 95 or more times out of 100 times, and having a really bad singing voice as having it come up up tails 95 or more times out of 100 times. There are relatively few ways that you can have a coin flip come up heads (or tails) 95% of the time, but many (many) more ways that you can have a coin flip come up roughly half heads and half tails. So, in practice most people would end up in the middle, not at the tails—thus the central hump.
Go forth and multiply
Suppose a person has an excellent, or at least well above average, singing voice. Does that mean they’ll have success as, say, a singer-songwriter? No, because a singer-songwriter by definition also needs to be able to write songs; more specifically, they need to write both melodies and lyrics. So there are now three things that they should ideally be well above average in, and those things are relatively independent: there are people who can sing well but not write catchy melodies, people who can write catchy melodies but not write good lyrics, and so on.3
To pull some numbers out of the air, let’s say that 20% of the population can sing pretty well, but only 5% can write catchy melodies and only 10% can write reasonably good lyrics. Then out of 100 million people we’d expect 20 million (20% of 100 million) to be able to sing well, 1 million to be able to sing well and write catchy melodies (5% of 20 million), and 100,000 (10% of 1 million) to be able to do all three. So in this example only 1 in 1,000 (100,000 out of 100 million) people have what it takes to be a singer-songwriter.
But it doesn’t end there. A potential singer-songwriter who wants to be successful also has to have the drive and conscientiousness to write and record lots of songs, the energy to tour, the ability to connect with audiences, the savvy to navigate the music business, and so on. Each of these requirements further reduces the potential talent pool, so that it may be that in a population of 100 million people there’s only about one in a million people who have what it takes to be a successful singer-songwriter.4
You can apply a similar analysis to any creative endeavor: writing novels, drawing comics, filming movies, making interesting podcasts or entertaining game run-throughs, and so on. In all of these cases many relatively independent factors will multiply together to determine overall skill-based success. The result will be a log-normal distribution: instead of most people clustering around an average level of success, with smaller tails to the left and right (as in a normal distribution), almost all people will have little or no success, and will thus form a very large cluster to the left. There will then be a very long right tail, with only a very few people in the extreme right of the tail having great success.
So, to sum up thus far: individual talents are hypothesized to be due to the additive effects of many independent factors, and thus to be normally distributed. However, having an overall skill set conducive to success in a given field of endeavor is hypothesized to be depend on the multiplicative effects of many different and relatively independent talents, and thus to follow a log-normal distribution.5
Luck and pluck
However, having an individual talent or even an overall set of talents is not necessarily sufficient to achieve success; often a fair amount of luck contributes to success, artistic and otherwise. We are used to attributing people’s success to talent and hard work—and of course people who are themselves successful are often the most extreme proponents of this. (After all, who wants to think that their own success is partly—let alone mostly—a matter of chance?)
This habit is so pervasive that we often attribute success wholly to merit even when it’s explicitly made clear that that’s not the case. For example, when people think of the 19th century novels by Horatio Alger, Jr. (when they think of them at all), they think of them as portraying the rewards that come from hard work. But if you actually read some of them (as I did), it’s clear that they are really stories of “pluck” and “luck”, with the latter typically given pride of place.
For example, in Alger’s first two novels, “Ragged Dick”, a homeless shoe-shine boy, is hard-working, honest, and open to new opportunities. But he becomes the successful businessman “Richard Hunter” only through a series of circumstances that combine mundane good fortune with incredibly implausible coincidences.
So, how might the effects of luck be modeled? Sornette, et al., treat it as an random additive component on top of what they call “overall skill.” They assume that overall skill is log-normally distributed (as discussed above) and acts to increase one’s already-achieved success by some percentage during each time period, with the exact percentage depending on the overall skill. Luck then acts to randomly enhance or counteract this effect of overall skill in each time period.
However good or bad luck does not affect everyone equally, but rather depends on a person’s appetite for risk: those who take more risks may benefit more than others from a given event of good luck, or may suffer more than others from an event of bad luck.
We see this, for example, in the Horatio Alger novels discussed above: the luckiest event of Dick’s young life occurs when he rashly leaps from a ferry to save a young boy who’s fallen overboard. The boy turns out to be the son of a business owner, who rewards Dick with a job in his establishment; the boy’s mother subsequently gives Dick a thousand dollars as a token of her own gratitude.6 But of course, in real life Dick’s selfless act might have brought no reward at all, or even resulted in his own death.
Modeling the effects of luck
As with overall skill, Sornette, et al., model the degree of risk taking using a log-normal distribution, presumably because, as with skill, it arises from several factors multiplied together: personality, social and economic situation, and so on. Thus some people would have an order of magnitude or more appetite for risk than others, and would be disproportionately rewarded (or punished) for their good (or bad) luck. Based on their simulation exercises they come to two conclusions:
First, they claim that the effects of luck may combine with the effects of overall skill to convert the distribution of overall success from a log-normal distribution to a power law distribution (as shown in the right hand graph above): at the top end would be people who benefited from extraordinary good luck and a taste for risk, beyond what their overall skills might justify, and likewise at the bottom end could be people with relatively high overall skills who have suffered bad luck of various kinds.
Second, they point out that in the short term it may be difficult to impossible to separate the effects of talent vs. luck. Only after a few years or even decades will it likely become apparent who has real staying power based on true talent and whose success was simply a matter of being in the right place at the right time, and little more than that.
Sornette, et al., give the example of success in investing in this context, but we also see this in artistic fields such as music. For example, think of all the acts who had #1 hits in their day but have had no lasting impact whatsoever. Think also of those acts who never achieved success due to bad luck of various kinds—internal conflicts, label troubles, financial problems, ill health or the death of a band member, or simply being out of step with contemporary trends—but who were rediscovered years later and acknowledged as exceptional artists. (Of course, in the meantime they lost out on the cumulative rewards of the success that eluded them.)
Conclusion
Sornette, et al., present one view of the interaction between talent, luck, and the society that rewards them both. As I mentioned above, there are other possible models as well, some putting more stress on the importance of luck, some putting more stress on talent, and others highlighting different factors, like the initial circumstances from which artists emerge.
But the overall picture is fairly clear: almost all would-be artists will be unsuccessful in both relative and absolute terms, and only a few artists will be truly successful. The question then becomes, what, if anything, should society do in terms of changing this picture? In particular, what stance should we take in terms of supporting current artists, or encouraging more people to become artists?
This is an especially pertinent question given the fear (or hope, as some might say) that we will be overwhelmed with a flood of AI-generated art (or “art,” in quotes, as some might say). Should we just accept that this is the way things are, and that it’s pointless to try to change it? I don’t personally believe that, but my thoughts on the matter are not yet fully-formed enough to summarize here. I’ll try to do that in a future post.
Royal Assassin (@RoyalAssassin) - 2023-02-26 16:42
Imagine being lucky enough to be born with a predisposition for having a good work ethic. Alas.
Frank Hecker (@hecker) - 2023-02-26 17:58
Yep, there are a lot of predispositions I wish I was born with :-(
Mightfo (@Mightfo) - 2023-02-26 16:46
Great post. Im also reminded of the quote by Gould “I am, somehow, less interested in the weight and convolutions of Einstein’s brain than in the near certainty that people of equal talent have lived and died in cotton fields and sweatshops.“
Even if you exclude economic factors, the vector of “did they pursue something they had talent for?” is a big factor imo. What are the chances of discovering different talents? Of pursuing those talents over other careers or other ways to spend time? Different cultures reward different talents and highlight different talents. Preexisting industries can be key to cultivate talents, like how voice acting in Japan is a lot more developed than most elsewhere. Audience size and language are also a major intersection- i think Finnish and Romanian are particularly beautiful languages, but they dont have the same audience to provide reverberating support for music and so on as English, Chinese, Spanish, etc.
Ill try to think more later about an idea of how things should be in this regard and maybe share those thoughts.
Frank Hecker (@hecker) - 2023-02-26 18:03
Your comments on place and time are very much on point. One of the papers I didn’t highlight was about how succeeding in the contemporary art world (i.e,, the sorts of art featured in, say, ArtForum) is highly influenced by the prestige level of the institutions an artist is associated with very early in their careers: art schools, galleries, etc. A great artist who comes from the middle of nowhere is going to find it difficult to impossible to achieve success.
I’d love to hear your thoughts on “how things should be”. (As I said, my own are still half-baked.)
For a general introduction see “Anatomy of the Voice.” ↩︎
The “normal” in “normal distribution” does not mean that we’re distinguishing between good (“normal”) vs. bad (“abnormal”) results or people. In fact, the terminology was more a matter of this type of distribution showing up in a lot of contexts, and hence being considered “normal” in the sense of “typical.” ↩︎
Singer-songwriters also typically need to be able to play the guitar or the piano. But people who are vocally trained to some degree or another also typically learn to play at least the piano, so that being able to play an instrument may not be that independent a factor from having an excellent singing voice. ↩︎
That would mean there might be only on the order of a couple hundred or so successful singer-songwriters currently active in the US. This sounds like a reasonable estimate: there are only about two thousand people working as full-time musicians in the US and only about four thousand American singer-songwriters from any era notable enough to have their own Wikipedia page. ↩︎
For folks who know what a logarithm is, the connection between the normal distribution and the log-normal distribution should be straightforward: taking the logarithm of the values in a log-normal distribution (a result of many relatively independent random variables being multiplied together) produces a normal distribution (a result of many relatively independent random variables being added together), just as taking the logarithm of a product produces the sum of the logarithms of the product’s terms. If you’re not familiar with logarithms, I wrote two posts where I tried to explain the concept to myself. ↩︎
To put this in perspective, at the time a typical entry-level wage was five dollars a week, so Dick’s good fortune amounted to about four years wages. In an example of luck begetting further luck, he used the money to successfully speculate on a land purchase in what is now the upper east side of Manhattan. ↩︎